1. Introduction to the Dynamic Time Oscillator
The Dynamic Time Oscillator (DTO) is a technical analysis tool designed to provide a richer and more dynamic view of market momentum. It combines the Relative Strength Index (RSI) and the Stochastic RSI, but introduces an additional dimension: a comparison between two different timeframes. This multi-timeframe approach makes DTO an advanced oscillator, ideal for both intraday traders and swing traders aiming to anticipate significant trend changes.
Unlike traditional oscillators that operate only within the current chart timeframe, the Dynamic Time Oscillator also computes a Stochastic RSI on a higher timeframe (e.g., daily). This broader perspective helps filter out false signals and improves the timing of trading decisions.
Additionally, the DTO displays the momentum direction of the higher timeframe using a color-coded histogram, offering immediate visual insight into the underlying strength of the market.
2. How the Indicator Works
The Dynamic Time Oscillator performs a dual-layer momentum analysis using the Stochastic RSI on both the current and a higher timeframe. This setup allows it to detect divergences and confirm movements with greater reliability.
Calculation on the Higher Timeframe
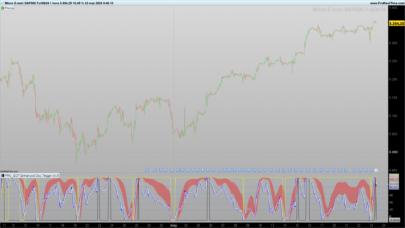
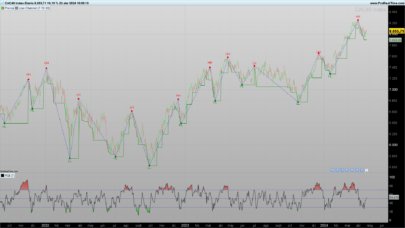
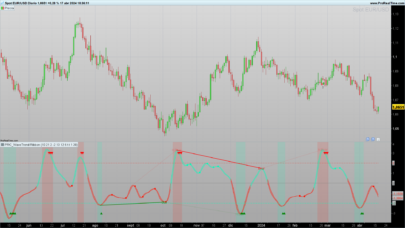
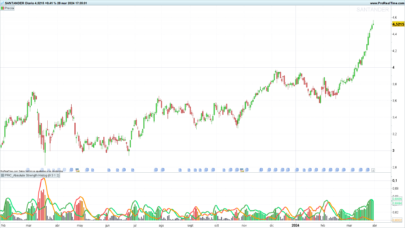
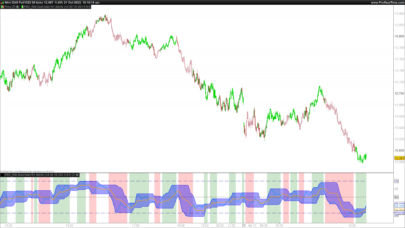
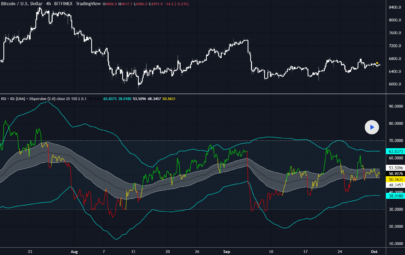
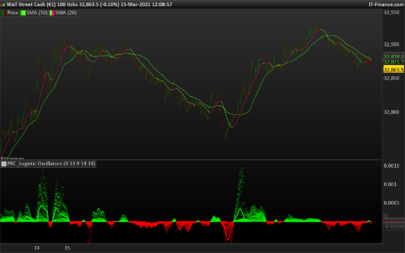
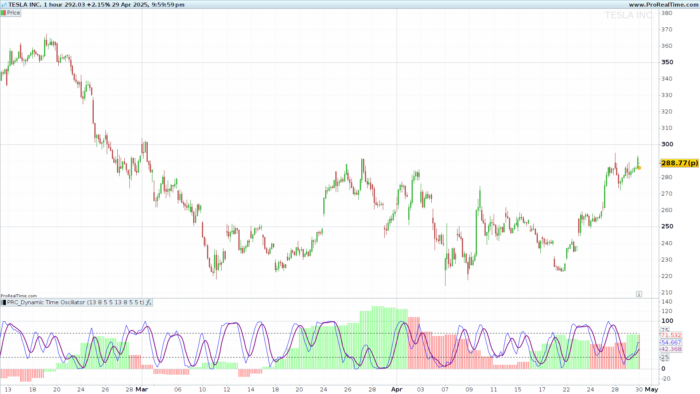
First, the DTO switches to a higher timeframe (default: daily) to compute an RSI over a user-defined period. This RSI is then normalized into a Stochastic RSI, which is smoothed with two moving averages: a fast line (%K) and a slow line (%D). The resulting %K value is displayed as a histogram.
This histogram is dynamically colored depending on the crossover between the two smoothed lines: green when %K is above %D (bullish bias), and red when it is below (bearish bias).
Calculation on the Current Timeframe
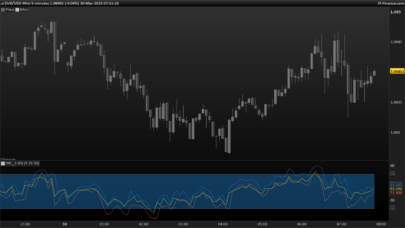
At the same time, the indicator performs the same RSI and Stochastic RSI calculations on the current chart’s timeframe, using user-defined parameters and smoothing values. These values are plotted as two separate lines (default: blue for %K, purple for %D) to help identify overbought or oversold conditions in the short term.
Combined Interpretation
The strength of this indicator lies in its comparative approach: the histogram reflects the broader trend on a higher timeframe, while the stochastic lines on the current timeframe help pinpoint precise entry or exit points. When both signals align (e.g., green histogram and bullish %K crossover), the trading setup gains higher confidence.
3. Indicator Settings
The Dynamic Time Oscillator allows customization of various parameters for both timeframes, making it adaptable to different trading styles and instruments.
Available Parameters
Current timeframe:
intRSIPeriod: RSI period (default 13). Controls sensitivity to price movements.intStochPeriod: Stochastic RSI period (default 8). Defines the range for RSI normalization.intSmoothK: Smoothing for the fast %K line (default 5).intSmoothD: Smoothing for the slow %D line (default 5).
Higher timeframe:
boolMTFUse: Enables or disables multi-timeframe overlay. Set to0to hide histogram.intHTFRSIPeriod: RSI period for the higher timeframe (default 13).intHTFStochPeriod: Stochastic RSI period for the higher timeframe (default 8).intHTFSmoothK: Smoothing for higher TF %K line (default 5).intHTFSmoothD: Smoothing for higher TF %D line (default 5).
Practical Recommendations
- For scalping or intraday trading, consider a 5 or 15-minute chart with an hourly or 4-hour higher timeframe.
- For swing trading, a 1-hour chart with a daily higher timeframe is a common setup.
- Horizontal levels at 25 and 75 serve as overbought and oversold thresholds. Crosses of these levels, especially when confirmed by histogram direction, can act as signal triggers.
4. Indicator Code for ProRealTime
|
1 2 3 4 5 6 7 8 9 10 11 12 13 14 15 16 17 18 19 20 21 22 23 24 25 26 27 28 29 30 31 32 33 34 35 36 37 38 39 40 41 42 43 44 45 46 47 48 49 50 51 52 53 54 55 56 57 |
"//--------------------------------------------------// //PRC_Dynamic Time Oscillator //version = 0 //18.04.25 //Iván González @ www.prorealcode.com //Sharing ProRealTime knowledge //--------------------------------------------------// // Inputs //--------------------------------------------------// sClose = close // RSI - Current Timefram intRSIPeriod = 13 // Stoch - Current Timeframe intStochPeriod = 8 intSmoothK = 5 intSmoothD = 5 // MTF Switch and Timeframe Selection boolMTFUse = 1//""Use MTF Timeframe Overlay?"" // RSI - Higher Timeframe intHTFRSIPeriod = 13 // Stoch - Higher Timeframe intHTFStochPeriod = 8 intHTFSmoothK = 5 intHTFSmoothD = 5 //--------------------------------------------------// // Calculations Higher Time Frame //--------------------------------------------------// timeframe(daily,updateonclose) HTFClose = close intHTFRSI = rsi[intHTFRSIPeriod](HTFClose) maxHTFrsi=highest[intHTFStochPeriod](intHTFRSI) minHTFrsi=lowest[intHTFStochPeriod](intHTFRSI) intHTFStochRSI=(intHTFRSI-minHTFrsi)/(maxHTFrsi-minHTFrsi)*100 maHTFStochK=average[intHTFSmoothK](intHTFStochRSI) maHTFStochD=average[intHTFSmoothD](maHTFStochK) if maHTFStochK>maHTFStochD then r=0 g=255 else r=255 g=0 endif //--------------------------------------------------// // Calculations Current Chart Period //--------------------------------------------------// timeframe(default) intRSI=rsi[intRSIPeriod](sClose) maxrsi=highest[intStochPeriod](intRSI) minrsi=lowest[intStochPeriod](intRSI) intStochRSI=(intRSI-minrsi)/(maxrsi-minrsi)*100 maStochK=average[intSmoothK](intStochRSI) maStochD=average[intSmoothD](maStochK) //--------------------------------------------------// return maHTFStochK as ""Higher TF StochK""style(histogram)coloured(r,g,0,100*boolMTFUse),25 as ""Oversold level""style(dottedline), 75 as ""Overbought level""style(dottedline), maStochK as ""Stoch Fast""coloured(""blue""),maStochD as ""Stoch Slow"" coloured(""purple"")style(line,2)" |
Share this
No information on this site is investment advice or a solicitation to buy or sell any financial instrument. Past performance is not indicative of future results. Trading may expose you to risk of loss greater than your deposits and is only suitable for experienced investors who have sufficient financial means to bear such risk.
ProRealTime ITF files and other attachments :
Find other exclusive trading pro-tools on ![]()
PRC is also on YouTube, subscribe to our channel for exclusive content and tutorials