

DPO-Detrended Price Oscillator
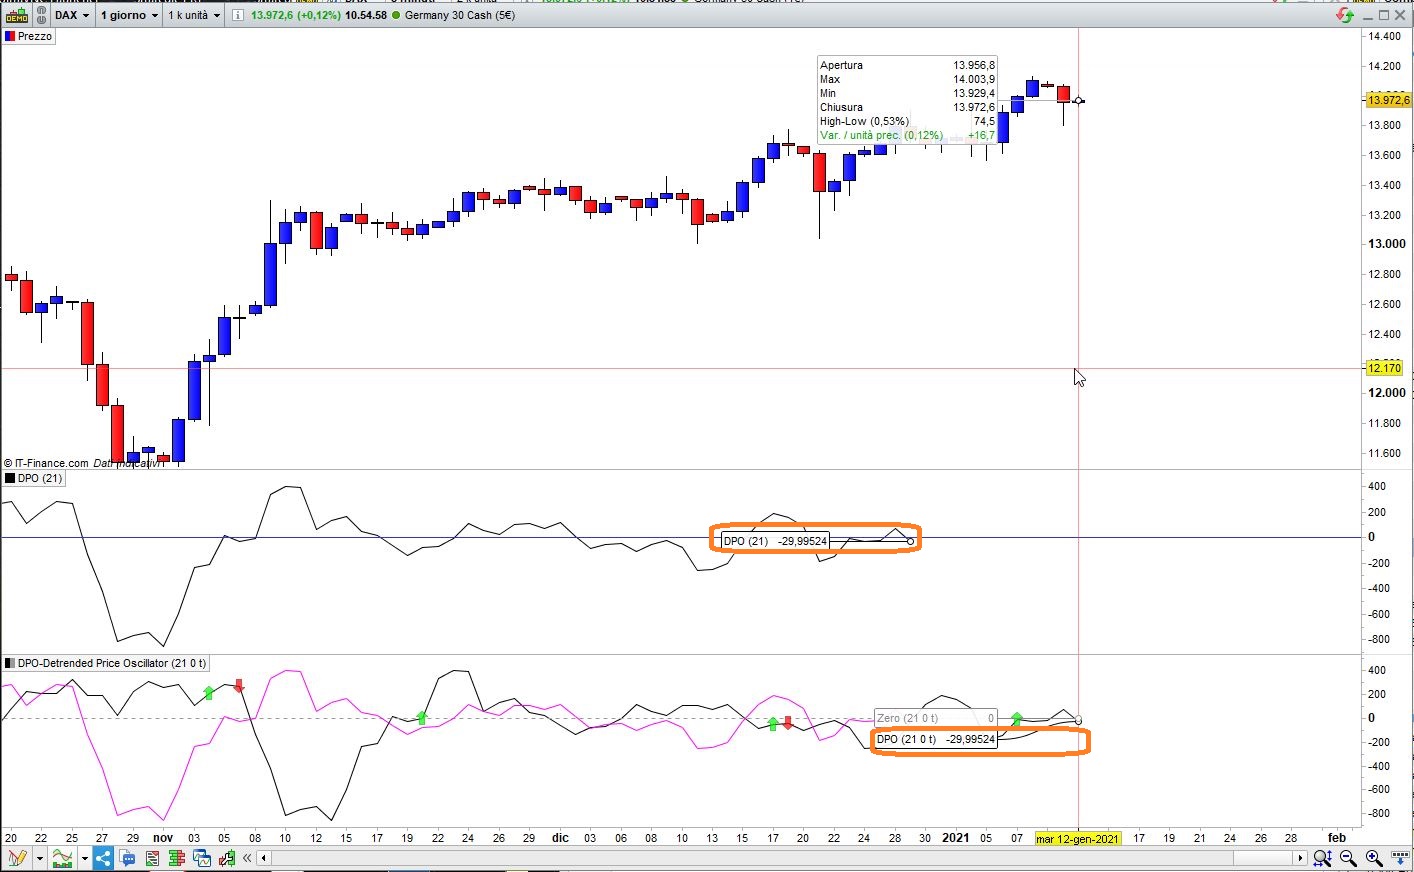
This version is identical, in calculations, to PRT’s built-in indicator, but this one can be used in autotrading, since it returns the current value, not the shifted one.
It also plots the shifted DPO like PRT.
If boolean variable ARROWS is ticked, then crossings between the current DPO and the one from the past, are signalled with arrows, in case thet are of interest.
———————————————————————————————————-
https://www.investopedia.com/terms/d/detrended-price-oscillator-dpo.asp
https://en.m.wikipedia.org/wiki/Detrended_price_oscillator
The detrended price oscillator (DPO) is an indicator in technical analysis that attempts to
eliminate the long-term trends in prices by using a displaced moving average so it does not react
to the most current price action. This allows the indicator to show intermediate overbought and
oversold levels effectively.
The detrended price oscillator is a form of price oscillator, like the “percentage price
oscillator” (PPO) and the “absolute price oscillator” (APO) both of which are forms of Gerald
Appel’s MACD indicator. The APO is an equivalent to the moving average convergence/divergence
(MACD) indicator while the PPO is an improved alternative to the APO or the MACD for use when a
stock’s price change has been large, or when comparing the oscillator behavior for different
stocks which have significantly different prices.
Although these are not so commonly used with the DPO, for the other price oscillators, as for the
MACD, a signal line is frequently generated for the price oscillators by taking an exponential
moving average (EMA) of the price oscillator values and plotting the two lines together.
A histogram can also be generated for the price oscillators, if desired, just as is done for the
MACD indicator.
Formula and calculation:
The DPO is calculated by subtracting the simple moving average over an “n” day period and
shifted n/2+1 days back from the price.
To calculate the detrended price oscillator:
Decide on the time frame that you wish to analyze. Set “n” as half of that cycle period.
Calculate a simple moving average for n periods.
Calculate (n / 2 + 1)
Subtract the moving average, from (n / 2 + 1) days ago, from the closing price:
DPO = Close – Simple moving average [from (n / 2 + 1) days ago]
// Periods = 21
// MAtype  = 0    (sma)
// Arrows  = 1
Periods    = max(1,min(999,Periods))
MAtype     = max(0,min(8,MAtype))
src        = CustomClose
n          = round((Periods / 2) - 0.5) + 1
MyDPO      = src[n] - Average[Periods,MAtype](src)
// Plot shifted DPO   (like Ichimoku's Chikou)
DrawSegment(BarIndex - n -1,MyDpo[1],BarIndex - n,MyDPO) coloured(255,0,255,255) //Fuchsia
//
Bullish    = close > open
Bearish    = close < open
// If ARROWS are ticked then display signals
IF Arrows THEN
   IF MyDPO CROSSES OVER  MyDPO[n] AND Bullish THEN
      DrawArrowUP(BarIndex,MyDPO) coloured(0,255,0,180)                          //Green
   ENDIF
   IF MyDPO CROSSES UNDER MyDPO[n] AND Bearish THEN
      DrawArrowDOWN(BarIndex,MyDPO) coloured(255,0,0,180)                        //Red
   ENDIF
ENDIF
//
RETURN MyDPO AS "DPO",0 AS "Zero"