DeMarker Indicator

DeMarker Indicator

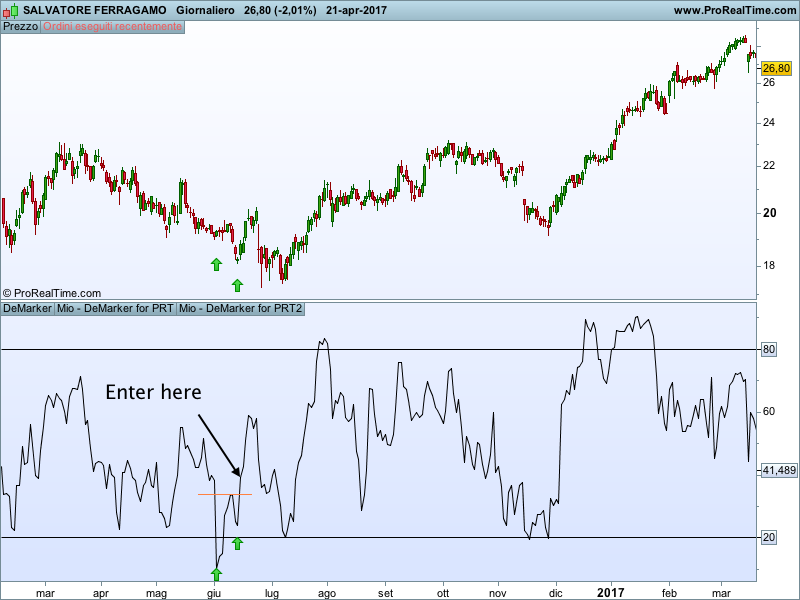
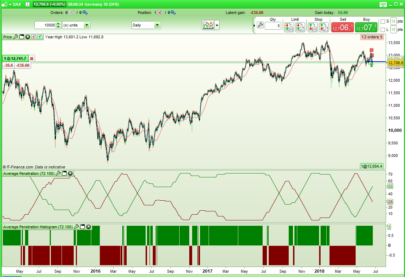
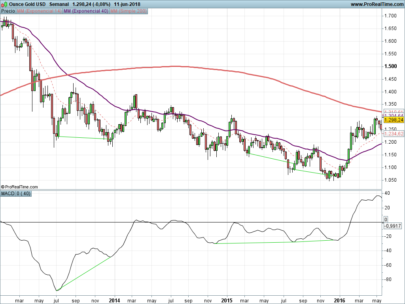
The DeMarker (DM) is a very good indicator to spot divergencies with price. In the way the DeMarker is computed it gives, often, even better signal than the RSI.

The way I use it. Once I find the divergence I wait until the DM crosses above the peak between the two bottom and enter long. The opposite for shorts.

Blue skies!!

Share this

Risk disclosure:

No information on this site is investment advice or a solicitation to buy or sell any financial instrument. Past performance is not indicative of future results. Trading may expose you to risk of loss greater than your deposits and is only suitable for experienced investors who have sufficient financial means to bear such risk.

ProRealTime ITF files and other attachments : How to import ITF files into ProRealTime platform?

PRC is also on YouTube, subscribe to our channel for exclusive content and tutorials

  1. Rogers • 04/22/2017 #

    Hi Gabri;
    thank you for your interresting indicator. Is it possible to give different names to the lines 20, 80 and price line? it can allow integration of your indicator in a auto strategy. 
    Regards,
    Rogers.

  2. gabri • 04/22/2017 #

    Rogers,
    if I understood correctly your question you can write a line like this:
    return ratio as \"Line\",20 as \"20\",80 as \"80\"
     

  3. Rogers • 04/22/2017 #

    Thank you Gabri for your reply. it is ok now for me. thanks again 🙂

  4. HeikinAshi • 04/22/2017 #

    How do you spot the divergences? Do you use an divergence-finder indicator?

  5. gabri • 04/22/2017 #

    HeikinAshi, you can use this divergency finder https://www.prorealcode.com/prorealtime-indicators/rsi-divergences-finder/ and set the variable a in the first line with a call function for the demarker.

  6. HeikinAshi • 04/22/2017 #

    Thanks Gabri, I thought in this direction. I’ll check it out, thanks!

avatar
Register or

Likes

avatar avatar avatar avatar avatar avatar avatar avatar avatar avatar avatar avatar
Related users ' posts
mangiaragni Buongiorno io non riesco a visualizzare nessun tipo di volume , mi torna sempre una linea dr...
Nicolas Assicurati che lo strumento che stai guardando abbia dei volumi! È il caso?
Nicolas Add it on price using the wrench on the left upper side of the price chart.
Stenozar thanks Nicolas, I' ll try again!
Radetzky Buongiono e grazie : l'immagine sopra ritrae l'indicatore sul TF 15 min ma a me funzio...
Steven Hi im looking for some help to put a automated code together BUY ORDER If EMA 10/25 is...
Dwell Thank you! Great tool!
ftrader8637 Any possibility to have this for multicharts. Sorry I am not a programer :-(
Nicolas Hi, we do not offer free assistance for other trading platform than ProRealTime. There is no...
MauroPro It is possible to apply this indicator ON the chart , because when I try to apply the formul...
Nicolas Yes, just apply it on the price chart by using the wrench on the left upper side of your pri...
MauroPro Hi Nicolas, thanks for the reply, I managed to apply the indicator on the chart.
Geronima Ortiz okay bien estaré pendiente en esta pagina gracias
Domenec Aqui dejo colgado link del video para ver como funciona el indicador https://www.youtube....
Geronima Ortiz Gracias Domenec
Juanjo Hola?. Exactamente cuál es su utilización?.
bolsatrilera Hola Juanjo, su principio esparecido a las bandas de Bollinguer.Las lineas de las bandas son...
Gordon101 Hi when I added your Guppy indicator to my chart it went below the chart beside the oscilla...
Nicolas Add it on the price by using the wrench located on the left upper side of your price chart.
Gordon101 Thanks Nicolas, worked a treat.
Geronima Ortiz I watched the video three times, but I can not put the npips parameter as a variable. I do...
Geronima Ortiz I think the video is for an old version of prorealtime, the images do not correspond at all ...
Nicolas indicator1 = CALL “PRC_StopReversal”[npips, 1] and define npips in the optimization window ...
Etienne Hi, thanks for proving this code. I would like to contribute by adding a computation speed...
Etienne //Compute Super Smoother coefficients once if barindex = 1 then a1 = exp( -1.414 * 3.14159...
Nicolas Thanks a lot!
Rafa And the PriceMAPeriod? aren´t the same?
Nicolas The PriceMAPeriod is the period to make the average of all the last X medianprice found.
Rafa Thanks a lot Nicolás. Have a nice day
bolsatrilera
7 years ago
Kairi Relative Index
0
Indicators
GraHal Wow! Thank you Vonasi, great idea!
Vonasi No Problem GraHal. Please share anything interesting that you find using it.
Vonasi I've made a small improvement by adding a Buy and Hold line for comparison. This line can be...
anametsinwha Is it possible to change it to highs and lows rather than open and close?
Caribeengeek Bonjour j’avais vu que vous proposiez d’écrire des codes pour ceux qui s’y connaisse pas Mai...
Caribeengeek Les devises unité
Nicolas Merci d'utiliser le forum pour les demandes de programmation personnalisée
juanj
7 years ago

Top