Cynthia Kase KRev Amounts

Cynthia Kase KRev Amounts

The KRev indicator – aka the Reversal amount indicator tells you the amount of dollar/pound/euro risk you’re exposed to on a unit basis if your position hits Kase Dev Stop 3 (Please see PRC Library for an explanation of the Kase Dev Stops: https://www.prorealcode.com/prorealtime-indicators/kase-dev-stop/).

The correct application of this KRev indicator will easily let you decide what time frame you can trade on to meet your fixed currency risk limit, per unit exposure.

For a better explanation as to why this indicator is so useful, please watch the following Kase StatWare presentation at 22 mins 08 secs to 31 mins 04 secs: https://www.youtube.com/watch?v=cd2gK8179u8

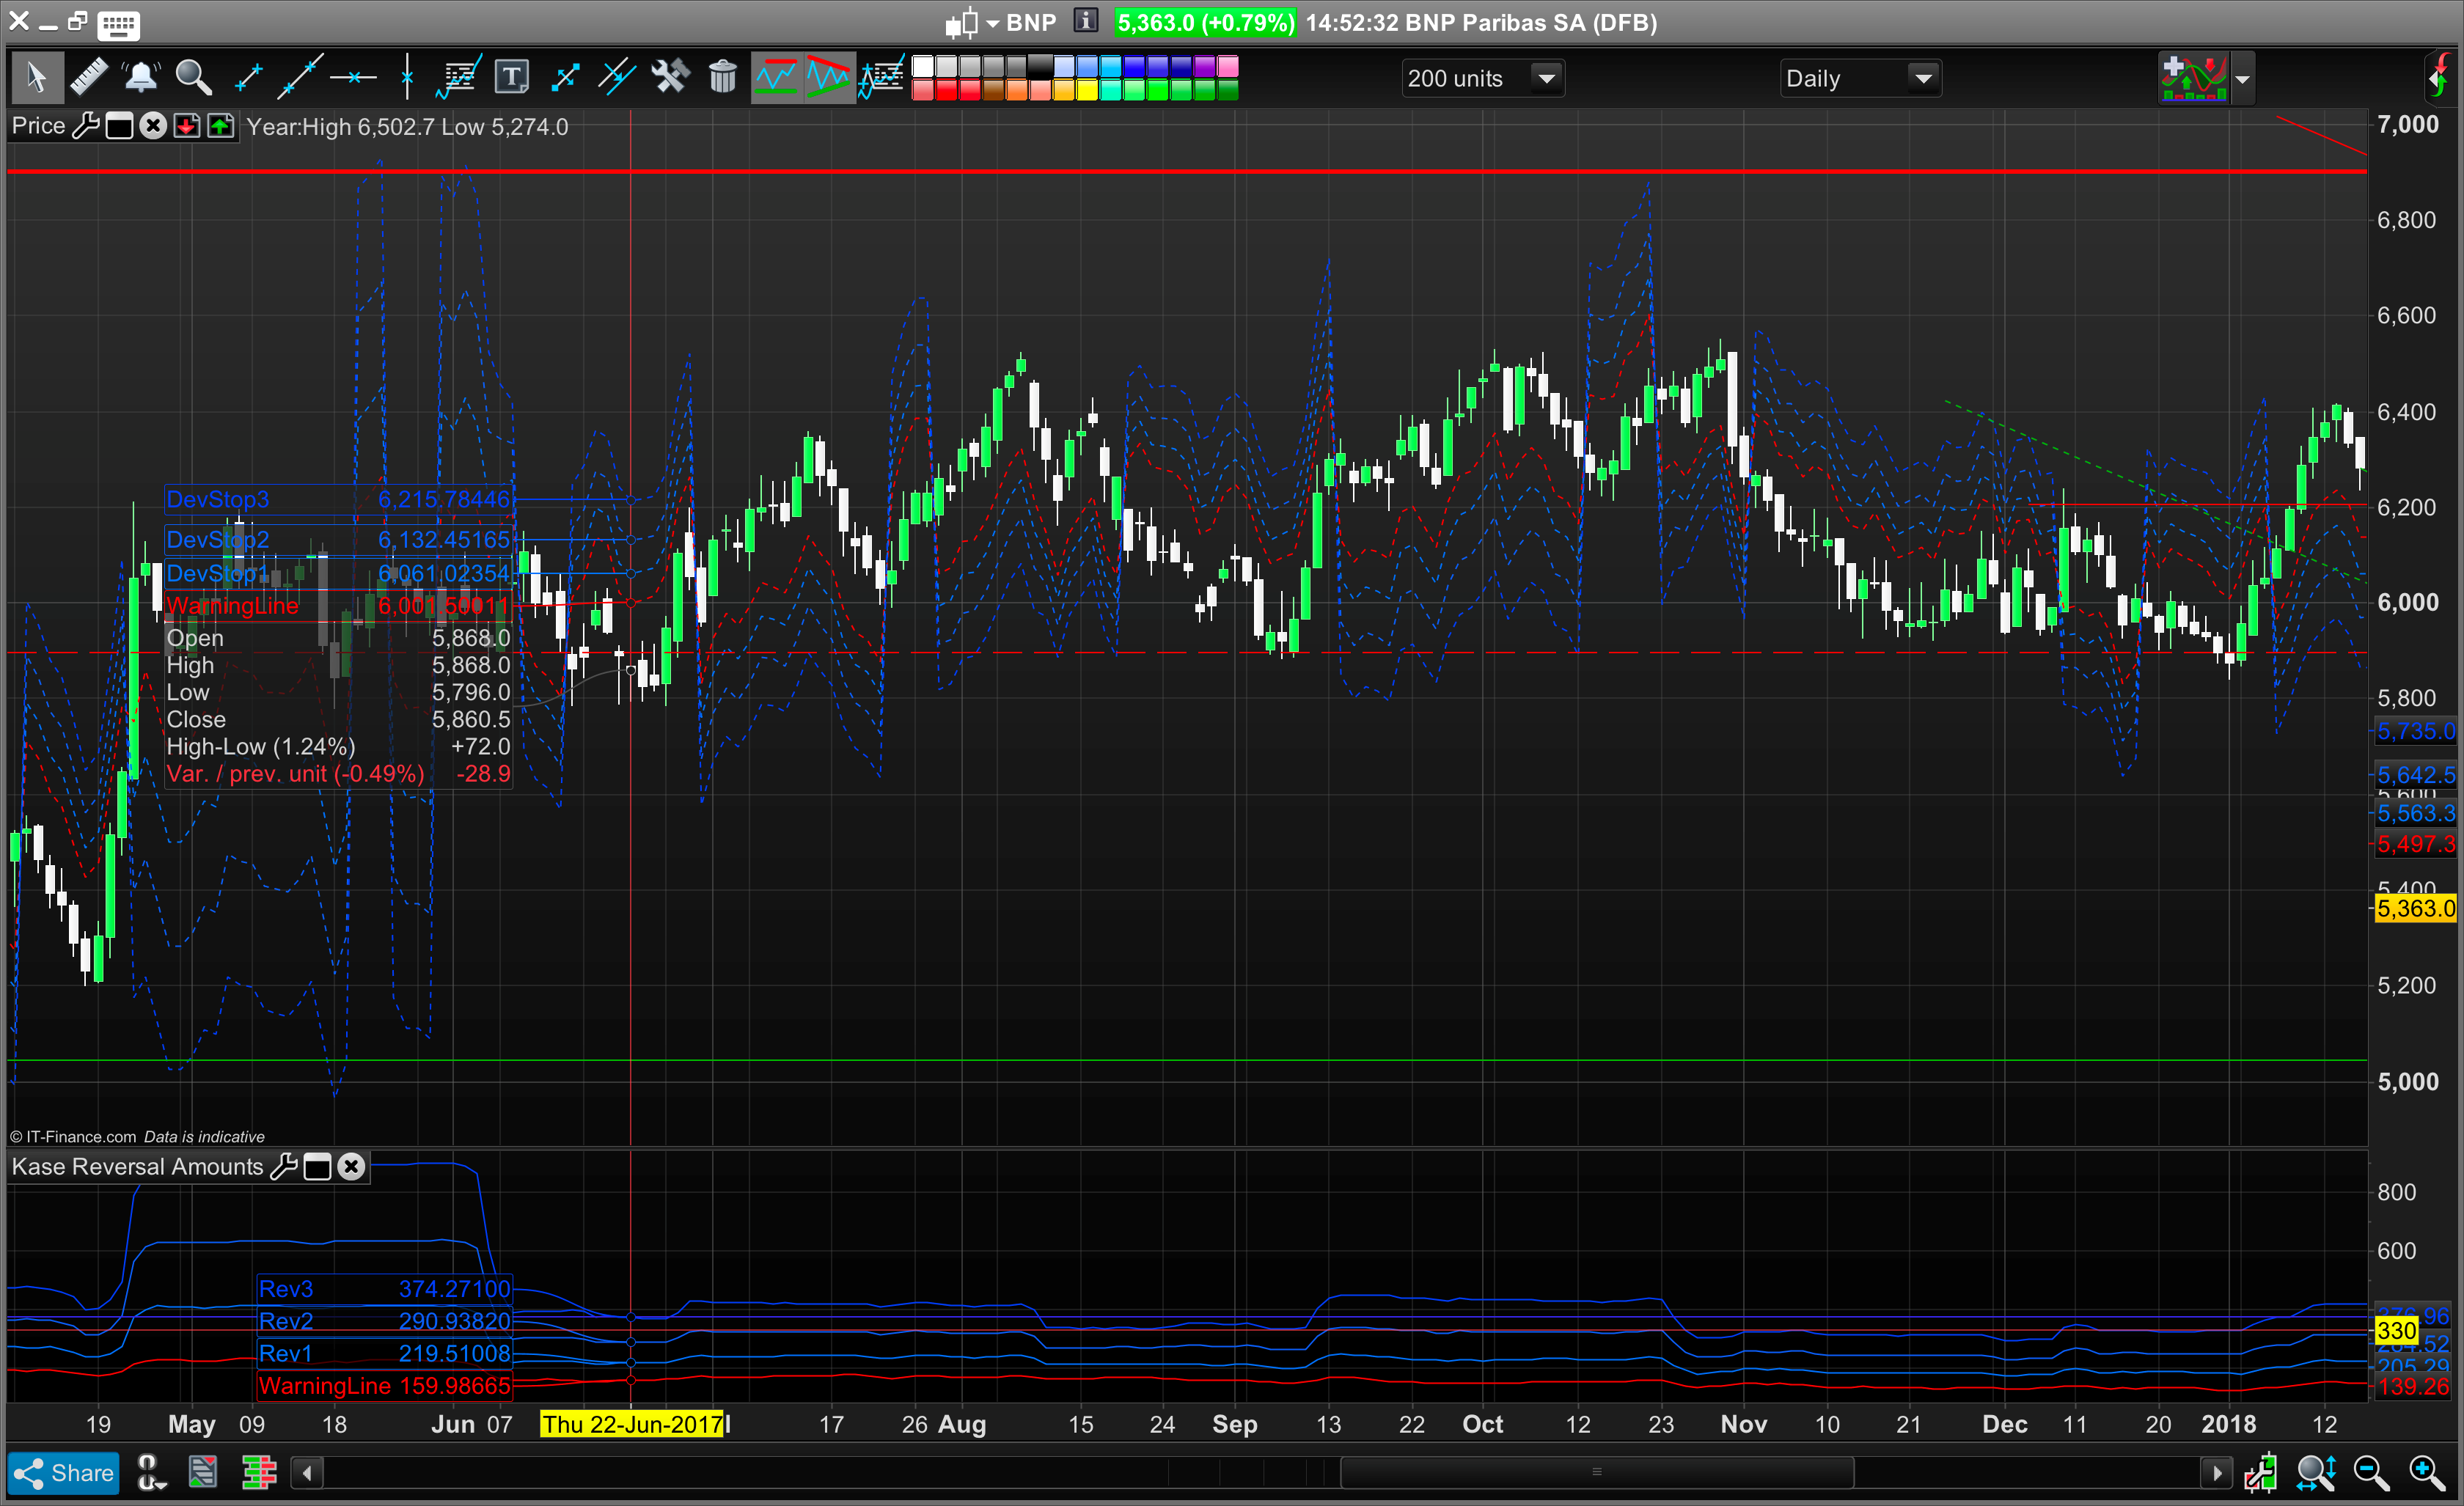
In the attached screen shot of BNP Bank the current price is €53.
The Euro risk is €3.74/share at Dev Stop 3.

Cynthia Kase: “The Dev Stop is the closest we can come to an ideal stop level in the real world.  The indicator mathematics accounts for volatility (which is directly proportional to risk), and also for the variance of volatility (how much risk changes from bar to bar) and volatility skew (the propensity for volatility to spike higher from time to time). Specifically, the Dev Stop places exit points at 1, 2 and 3 standard deviations over the mean two bar true range, are corrected for skew. So we can take profit or cut losses at levels at which the probability of a trade remaining profitable is low, without taking more of a loss or cutting profits any sooner than necessary.

Dev Stop 3 represents the “Get out of your position NOW!” statistically significant 3 standard deviation move against your trade with only a 0.1% chance of reversal. This is the point of no return to break even or profit – i.e. the highly improbable reversal that we as traders hope for when holding losses and which rarely happens.

It is calculated from a mathematically and statistically sound basis – 70 years worth of commodity/stocks and currency backtesting by Cynthia Kase and her team and includes an adjustment to account for price volatility skew in the market. This allows the data to reflect a normal distribution of ATR values and therefore confidence intervals and percentile probabilities – see the so-called 68–95–99.7 rule below. Skewness is a measure of the asymmetry of the probability distribution of a real-valued random variable about its mean. (Market price skew occurs because prices are not normally distributed and are bounded by zero – the price can never go below zero – but can potentially reach extreme values on the right hand side of the bell curve).

For a normal distribution bell curve, for example, a stop placed at the one standard deviation level has an 85% chance of being hit. Cynthia Kase designed the Dev Stop to withstand any 2 bar reversal so you’re not unnecessarily stopped out. Kase: “Our stops can be as the doorway that most (97.5 percent) of our two-bar reversals can pass through. Only the tallest sets of bars (candlesticks) will be blocked. (ie Allows position to remain open and only stop us out when prices hit extreme values ie. the remaining 2.5% of the price distribution).”

1 Std Devs = 68.2% of data falls within this range with a 84.1% chance of being hit — i.e. that a value will hit this probability percentile.

2 Std Devs = 95.4% of data falls within this range with a 97.7% chance of being hit.

3 Std Devs = 99.7% of data falls within this range with a 99.9% chance of being hit.


The “hope and pray” approach to an open trading loss reversing (back to break even) is no longer required 😁

Share this

Risk disclosure:

No information on this site is investment advice or a solicitation to buy or sell any financial instrument. Past performance is not indicative of future results. Trading may expose you to risk of loss greater than your deposits and is only suitable for experienced investors who have sufficient financial means to bear such risk.

ProRealTime ITF files and other attachments : How to import ITF files into ProRealTime platform?

PRC is also on YouTube, subscribe to our channel for exclusive content and tutorials

  1. Bard • 06/22/2018 #

    An important point about the moving averages that determine whether Kase’s Dev Stops are above or below the price:

    The moving average crossovers are not important. They should be used and changed to a faster cross if you have entered a position and the 5 and 21 day cross has not reflected the direction of your trade. I.e. change the averages to a 3 and 8 day moving average cross over (or whatever is suitable) so that the Kase Dev Stops are on the correct side (above or below) of your position.

    
See: Kase Chat – Stops and Kase DevStops (around the 21 min mark)
    https://www.youtube.com/watch?v=u8pFuM2TNfA (link button not working using Mac and Safari)

  2. juanj • 06/22/2018 #

    I have changed the moving averages to exponential and personally use the 9ema and 21ema

  3. juanj • 06/22/2018 #

    You could also just calculate the bands on both sides of price

    • Bard • 06/22/2018 #

      Thanks Juanj, Kase developed the double sided KaseX Xstops:
      https://www.dropbox.com/s/0shxnxe83334iah/CAT-Daily-with-Stochastic-and-Xstops.png
      with faster Mov Averages for the counter trend.

      I did change mine to the Serial Dependency Index before realising it doesn’t really matter what you use as long as the Dev Stop is on the right side of your trade. Umm added the code here and it’s not showing…

      Maybe you would like to post the double sided code and the code for the SAR here?

      The real problem for me with the current PRT Dev Stop code that I provided from another forum is that there is something I’ve become aware of regarding the Kase Dev Stops indicator, having read and seen more of Cynthia Kase’s work:

      On the PRT version the Dev Stops just hug the price. I rarely see the candlesticks actually hit the Warning Line (the mean of the 2 day ATR) or penetrate into the three Dev Stops (1, 2 and 3 Std Deviation ATR Stops)? The price does hit the Dev Stops if the 10 and a 21 period moving average cross just happens to also occur at the same time – and which makes the Dev Stops flip from being, for example, above the price to below it.

      Here are a few examples of Kase’s charts showing the price penetrating into the Dev Stops as they were intended – after all this is the point you’re meant to get out…
      https://www.dropbox.com/sh/dcyksl47a7hzldc/AACkbsrQg2I19gw-jrZs5rY5a

      Here’s another site that had worked out the Dev Stop code: https://www.mql5.com/en/code/19926

      Maybe with your coding skills Juanj you can figure out why this is?

      Cheers
      Bard

  4. Bard • 06/22/2018 #

    Thanks for the tip on calculating both sides Juanj. As Dean Rogers of Kase StatWare said about the moving averages: “I cannot stress how meaningless that 10 and 21 day MVG actually is. It’s just the way we control the flipping of the Stops.”

  5. gabri • 06/22/2018 #

    Bard,
    where do you use the variable price in the code?

    • Bard • 06/22/2018 #

      Apologies Gabri, that line (price = typicalprice) is stripped out in my PRT charts, but not the text edit version I save all code into and play around with and which was used here. It’s a volatility indicator based on DTR which includes price highs and lows. (I’m hoping @nicolas will find time to put up the correct screen image with just the price and the KRev indicator pane below the price chart. I’ll post the dropbox link with that cleaner image in a fresh comment below.

  6. JohnScher • 06/22/2018 #

    Small inquiry.

    Can any of you reprogram it so that the lines are directly “onChart” visible?
    After importing the itf file, I get this image…

    • Bard • 06/22/2018 #

      Hi JohnScher, “I get this image…” There’s no image, what are you seeing?

  7. Bard • 06/22/2018 #

    Clear screenshot of just the BNP price chart and the indicator KRev pane below it,
    here: https://www.dropbox.com/s/qb9e3dp722dpfbs/Kase-KRev-Amounts.png?dl=0

  8. juanj • 06/22/2018 #

    I have found an ingenious way of deciding which side the lines should be projected! I basically apply the same logic as SAR. In other words, if short and price closes above the lowest KRev3 I switch them to long and then if long and price close below the highest KRev3 I switch back to short. This is statistically in line with what the indicator is supposed to tell us in the first place. Actually, surprised KaseCo haven’t thought of this themselves and instead opted for a MA crossover.

    • Nicolas • 06/22/2018 #

      Nice idea! Keep up the good work 😉

  9. Bard • 06/22/2018 #

    Kase Dev Stop Using Serial Dependency Index to Flip Stops

    //pararemeters:
    n = 20 //30
    d = 40 //21

    DTR = max(max(High – Low[2], abs(High – Close[2])),max(abs(Low – Close[2]),(abs(Low – Close[2])))) //Double True Range

    price = typicalprice

    avg = average[n](DTR)

    st = std[n](DTR)

    If DI[d](close) < 0 then

    WarningLine = price+avg
    Dev1 = price+avg + st
    Dev2 = price+avg + 2.4*st
    Dev3 = price+avg + 3.6*st

    else

    WarningLine = price-avg
    Dev1 = price-avg – st
    Dev2 = price-avg – 2.4*st
    Dev3 = price-avg – 3.6*st
    endif

    RETURN Warningline coloured(255,0,0) as "WarningLine", Dev1 coloured(2, 118, 253) as "DevStop1", Dev2 coloured(20, 100, 244) as "DevStop2", Dev3 coloured(1, 71, 250) as "DevStop3"

  10. juanj • 06/22/2018 #

    Here is my SAR approach (I only initialize using the MA crossover):

    *I do not make use of the warning line and DevStop1 as they are way too easily hit

    //KASE Deviation Stoploss Bands

    n = 30

    DTR = max(max(High – Low[2], abs(High – Close[2])),max(abs(Low – Close[2]),(abs(Low – Close[2]))))
    avg = average[n](DTR)
    st = std[n](DTR)

    maFast = average[9,1](close)
    maSlow = average[21,1](close)

    once DevInit = 1

    If DevInit = 1 Then
    If maFast > maSlow Then
    DevLong = 1
    DevLongC = 0
    Else
    DevLong = 0
    DevShortC = 0
    EndIf
    DevInit = 0
    ElsIf DevInit = 0 and DevLong = 1 Then
    HighestDev3 = Dev3
    For y = 1 to DevLongC Do
    If Dev3[y] > HighestDev3 Then
    HighestDev3 = Dev3[y]
    EndIf
    Next
    If close < HighestDev3 Then
    DevLong = 0
    DevShortC = 0
    EndIf
    ElsIf DevInit = 0 and DevLong = 0 Then
    LowestDev3 = Dev3
    For x = 1 to DevShortC Do
    If Dev3[x] LowestDev3 Then
    DevLong = 1
    DevLongC = 0
    EndIf
    EndIf

    If DevLong = 1 Then
    DevLongC = DevLongC + 1
    //WarningLine = typicalprice-avg
    //Dev1 = typicalprice-avg – st
    Dev2 = typicalprice-avg – 2.2*st
    Dev3 = typicalprice-avg – 3.6*st
    ElsIf DevLong = 0 Then
    DevShortC = DevShortC + 1
    //WarningLine = typicalprice+avg
    //Dev1 = typicalprice+avg + st
    Dev2 = typicalprice+avg + 2.2*st
    Dev3 = typicalprice+avg + 3.6*st
    EndIf

    Return Dev2 coloured(20, 100, 244) style(dottedline,1) as “DevStop2”, Dev3 coloured(255, 0, 0) style(dottedline,1) as “DevStop3”

  11. Bard • 06/22/2018 #

    Thanks very much Juanj, it through up some errors when I loaded it? What is the C in DevLongC refer to?

    Nicolas is taking another look at the Dev Stop coding re: the issue of price not penetrating into the Dev Stops. The Warning Line and Dev 1 are important in that not only do they provide early warning of trend changes but they can be traded according to Kase’s Follow Through and Stop Beyond probability Tables.

    https://cmtassociation.org/wp-content/uploads/2015/11/0610-kase.pdf
    page 45

    Cheers
    Bard

  12. juanj • 06/22/2018 #

    DevLongC and DevShortC keeps track of the number of bars that the DevStops are either long or short. This is used to find the lowest and highest DevStop3 levels for the period.

  13. juanj • 06/22/2018 #

    C = Count

  14. Bard • 06/22/2018 #

    Thanks for the explanation. I couldn’t get it to load anyway.

  15. Khaled • 06/22/2018 #

    Hello everyone, I’m coming late into this discussion… Brad cannot load the code because there is one operator “<" missing line 42 and one "Next" missing line 46. The below code codes works for me. If Juan wants to check…

    //KASE Deviation Stoploss Bands

    n = 30

    DTR = max(max(High – Low[2], abs(High – Close[2])),max(abs(Low – Close[2]),(abs(Low – Close[2]))))
    avg = average[n](DTR)
    st = std[n](DTR)

    maFast = average[9,1](close)
    maSlow = average[21,1](close)

    once DevInit = 1

    If DevInit = 1 Then
    If maFast > maSlow Then
    DevLong = 1
    DevLongC = 0
    Else
    DevLong = 0
    DevShortC = 0
    EndIf
    DevInit = 0

    ElsIf DevInit = 0 and DevLong = 1 Then
    HighestDev3 = Dev3

    For y = 1 to DevLongC Do
    If Dev3[y] > HighestDev3 Then
    HighestDev3 = Dev3[y]
    EndIf
    Next

    If close < HighestDev3 Then
    DevLong = 0
    DevShortC = 0
    EndIf

    ElsIf DevInit = 0 and DevLong = 0 Then
    LowestDev3 = Dev3

    For x = 1 to DevShortC Do
    If Dev3[x] < (LowestDev3) Then //try = or > or <
    DevLong = 1
    DevLongC = 0
    EndIf
    Next // next was missing
    endif

    If DevLong = 1 Then
    DevLongC = DevLongC + 1
    //WarningLine = typicalprice-avg
    //Dev1 = typicalprice-avg – st
    Dev2 = typicalprice-avg – 2.2*st
    Dev3 = typicalprice-avg – 3.6*st
    ElsIf DevLong = 0 Then
    DevShortC = DevShortC + 1
    //WarningLine = typicalprice+avg
    //Dev1 = typicalprice+avg + st
    Dev2 = typicalprice+avg + 2.2*st
    Dev3 = typicalprice+avg + 3.6*st
    EndIf

    Return Dev2 coloured(20, 100, 244) style(dottedline,1) as “DevStop2”, Dev3 coloured(255, 0, 0) style(dottedline,1) as “DevStop3”

avatar
Register or

Likes

avatar avatar avatar
Related users ' posts
Nicolas Sorry there was a small issue in the code, i have changed the attached itf file and updated ...
Mitchy14 Hi Nicholas, apologies, I am usually fairly good at implementing your creations (for which I...
Nicolas Are you using PRT version pre-v11? TIMEFRAME for indicators is possible since months for pro...
Zigo Zou je graag helpen, maar mijn computer is in onderhoud. Einde deze week, kan ik hopelijk te...
Zigo @ DimKar Midline = (stlong + stshort)/2 Return stLong coloured(0,255,0) as"StopLong", M...
DimKar Dear Zigo thank you very much for your answer !!!
Bard Hi @Ale, I was wondering if you knew why, when I went to put the Kase Peak Oscillator into i...
ALE Hello Bard, because they are two different indicators
Bard Right, thanks Ale, I have taken your code and made a coloured Peak Osc (thanks again) but ...
joobeng Sorry, I solved the problem. I have add the CBL indicator using the spanner icon on the pric...
Nicolas Adjust the price settings for the Y Axis to use the price only.
XXXXVII Hello Your indicator is interesting. However, I can't see the orange line. Do you have ...
Nicolas Definition of CustomClose: https://www.prorealcode.com/documentation/customclose/ [2] means...
Bard Just wondered Nicolas, say you had set DEFPARAM CumulateOrders = True, is there anyway for t...
Bard Sorry pls ignore last image, try this - it actually has the Dev Stop indicator! https://www...
Nicolas Rien, il faut l'appliquer sur la charte. Soit le mettre sur le graphique du prix, à l'aide d...
signorini Merci pour votre réponse. Je l'applique sur la charte, j'utilise la petite clé pour effacer ...
signorini Je vous remercie, Nicolas. C'est fixé. Très bon week-end.
denmar Hi Could somebody please enlighten me how this code operates. I wish to use the code (is...
denmar Testing email notification to Denmar
David Black #gm74 Did you ever get this figured out? gm74
GraHal Hi Nicolas I like this and would like to understand it fully so please forgive the (maybe) d...
Nicolas Hi GraHal, the Factor parameter is only a multiplier of the ATR that is added or subtracted ...
GraHal Nicolas, thank you for your useful and informative response. Yes I optimise using ProBackte...
sr021 Hi I tried to copy and paste the code, but recieve the message  : Syntax error:The followi...
Nicolas Hello, of course. You have 3 options : 1/ you download the file and import it into your plat...

Top