




More from ProRealCode
ProRealCode - Trading & Coding with ProRealTime™
The ProRealTime™ community on the web! Officially sharing ProRealTime knowledge to Worldwide users since 2015!



DeMarker Indicator
April 22, 2017, 7:59 PM
Indicators
6 Comments
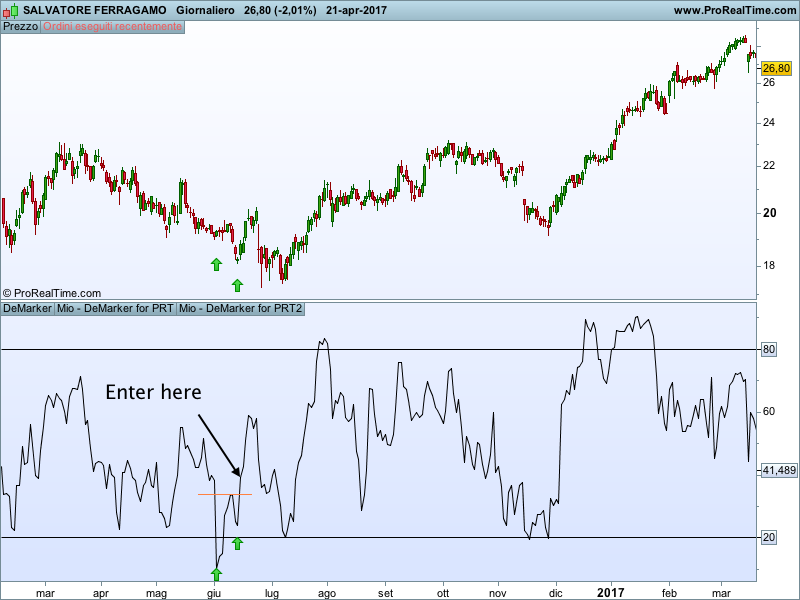
The DeMarker (DM) is a very good indicator to spot divergencies with price. In the way the DeMarker is computed it gives, often, even better signal than the RSI.
The way I use it. Once I find the divergence I wait until the DM crosses above the peak between the two bottom and enter long. The opposite for shorts.
Blue skies!!
//DeMarker Indicator
period=14
up=max(0,high-high[1])
down=max(0,low[1]-low)

ratio=100*average[period](up)/(average[period](up)+average[period](down))

return ratio as "DeMarker",20,80
Download
Filename:
Mio-DeMarker-for-PRT.itf
Downloads:
360
Master
Developer by day, aspiring writer by night. Still compiling my bio... Error 404: presentation not found.
Author’s Profile
Similar code
Multi-Indicator Signal EngineIndicators
Peek+ Indicator for reversalsIndicators
Ehlers Decycler Indicator 1-2 PoleIndicators
Vortex Indicator ScreenerScreeners
Comments
You must be logged in to post a comment.

8 years ago
How do you spot the divergences? Do you use an divergence-finder indicator?

Loading...
Thanks Gabri, I thought in this direction. I'll check it out, thanks!