







LBR-RSI
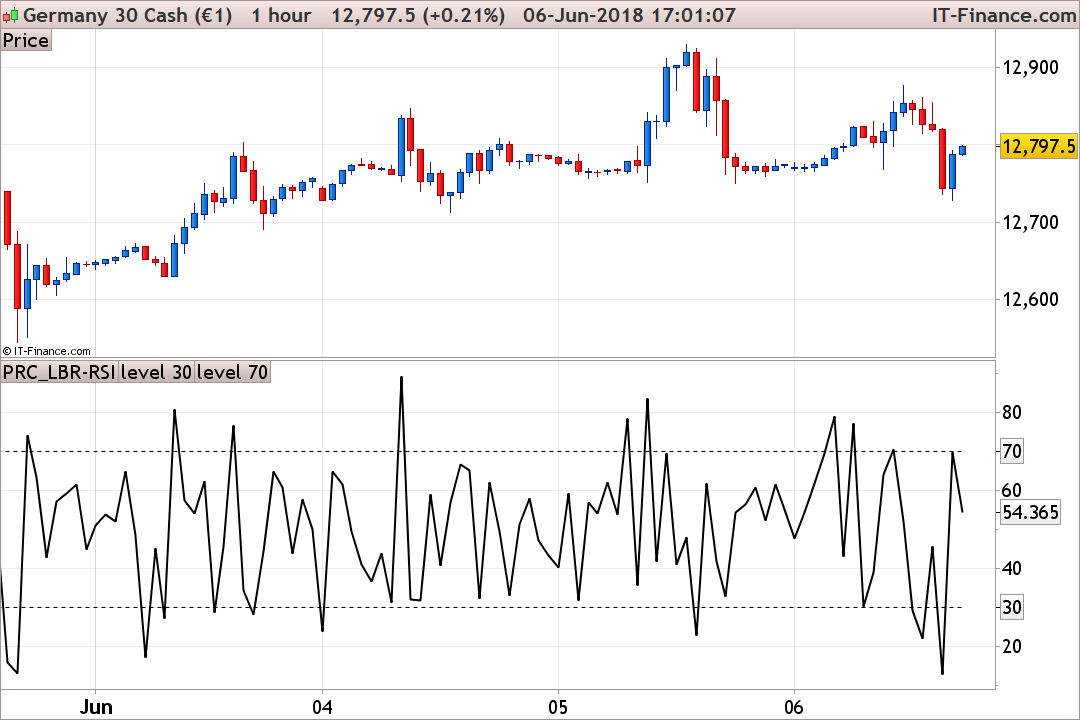
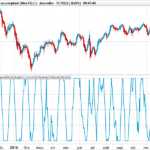
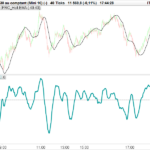
LBR RSI indicator is a 3 periods RSI (Relative Strength Index) of the momentum change (using ROC, Rate Of Change indicator of 1 period).
This pattern uses a one-period rate of change or ‘momentum’ function. This is simply the difference between today’s close and yesterday’s close. I.e., if today’s closing price is 592 and yesterday’s closing price was 596, the difference is -4. A three-period RSI of this one-period change is calculated.
lbrrsi = rsi[3](roc[1])

return lbrrsi style(line,2), 30 style(dottedline) as "level 30", 70 style(dottedline) as "level 70"
Comments
You must be logged in to post a comment.

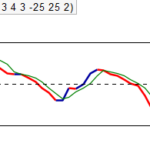
If you smooth the signal using a "summation" function, you get a nice "crossing of 0" graph. Summation acts in this case like an "Integral" function. Try by substituting lbrrsi = rsi[3](roc[1]) by lbrrsi = (summation[8](rsi[3](roc[1])))/8 Thanks a lot for your continuous and extremely useful contributions.

Greatly appreciated Nicolas!