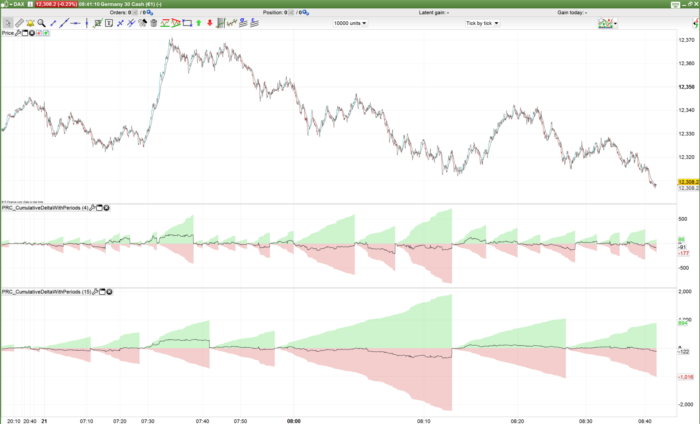
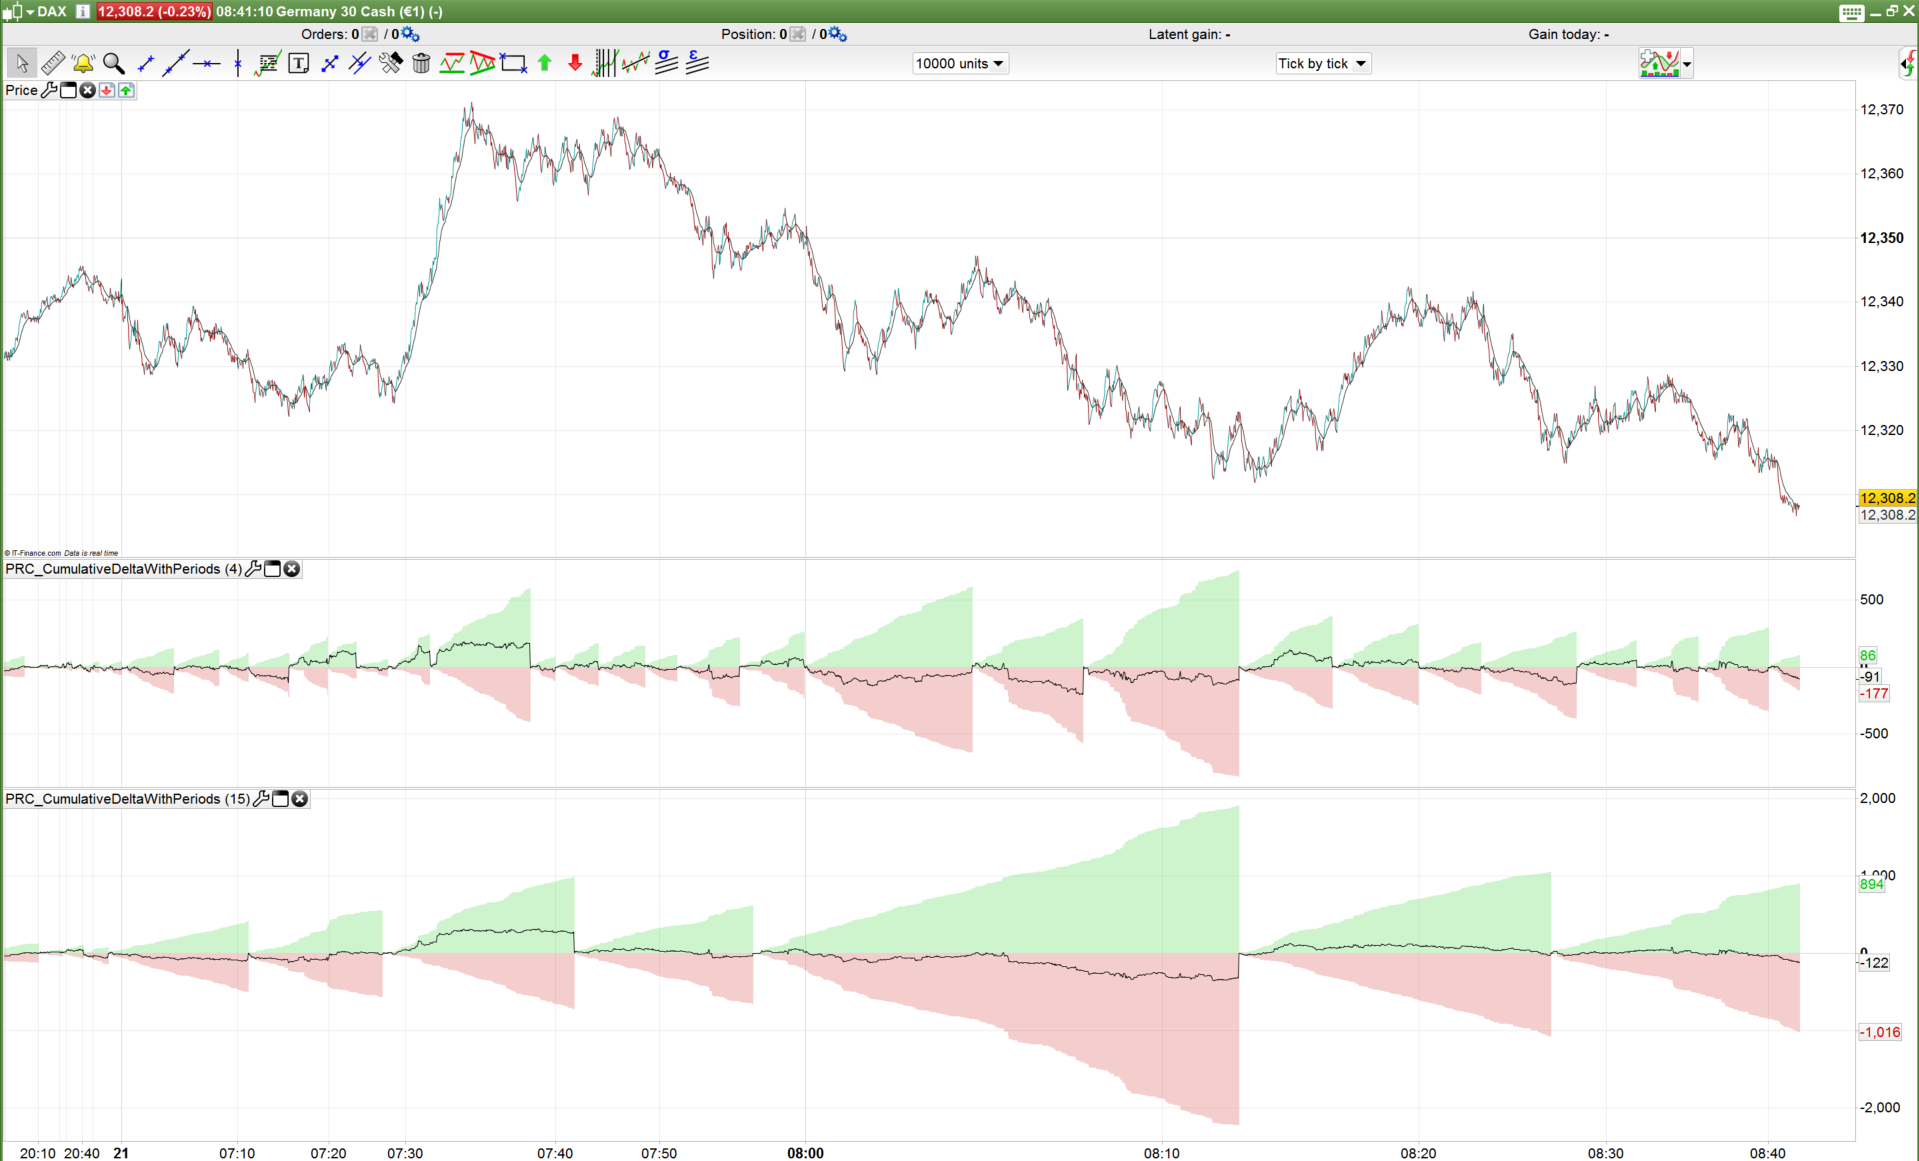
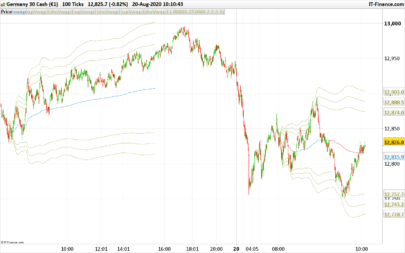
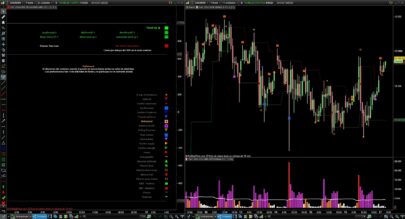
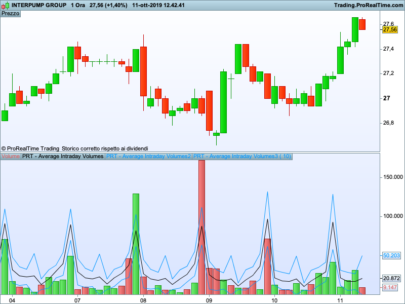
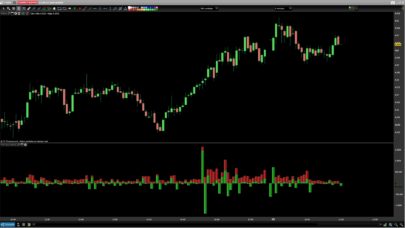
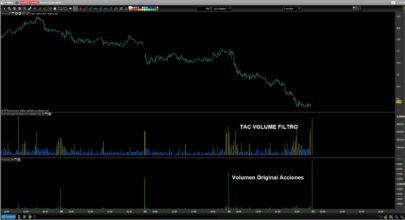
Because it is not possible to get the bid/ask volumes into an usual timeframe (such as the 1 minute one for example), I had the idea to use the “tick by tick chart” to get them. In this kind of chart, each price movement is x ticks received.
Each time the price is higher than the previous received one, the code count the Volumes received as a positive one, same goes for a lower price received, counting as a negative Volumes.
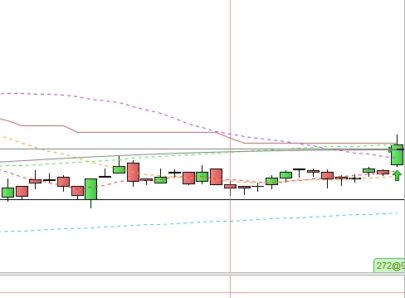
These Volumes counts are accumulated and plotted as green and red histograms. Then a “Cumulative Delta”, which is the difference of the 2 histograms is plotted as a black line.
When the Cumulative Delta is crossing below the zero line, the bearish pressure is real, while the bullish one exist when the Delta is crossing above zero level.
I add a setting to reset the Cumulative Delta to zero each X minutes with the “minutes” parameter. So it is possible to stack many Cumulative Delta on the same chart with different “minutes” settings to get the large picture and smaller one(s).
Note: This indicator is only compatible on a ‘Tick by Tick’ chart with instruments which have Volumes.
|
1 2 3 4 5 6 7 8 9 10 11 12 13 14 15 16 17 18 19 20 21 22 23 24 25 26 27 28 29 30 31 32 33 |
//PRC_CumulativeDeltaWithPeriods | indicator //21.03.2018 //Nicolas @ www.prorealcode.com //Sharing ProRealTime knowledge // --- settings iminutes = 4 // in minutes quantity // --- end of settings newperiod = minute<>minute[1] if newperiod then count=count+1 endif if count=iminutes then count=0 volp=0 volm=0 endif if volume>0 then if close>last then last=close volp = volp+volume elsif close<last then last=close volm = volm+volume endif delta = volp-volm endif return volp coloured(0,200,0,50) style(histogram) as "Positive volumes", -volm coloured(200,0,0,50) style(histogram) as "Negative volumes", delta as "Volume delta" |
Share this
No information on this site is investment advice or a solicitation to buy or sell any financial instrument. Past performance is not indicative of future results. Trading may expose you to risk of loss greater than your deposits and is only suitable for experienced investors who have sufficient financial means to bear such risk.
ProRealTime ITF files and other attachments :
Find other exclusive trading pro-tools on ![]()
PRC is also on YouTube, subscribe to our channel for exclusive content and tutorials


Merci encore pour cet indicateur Nicolas.
Juste pour ma formation personnelle en matière de langage PRT, je ne comprends pas ceci : minuteminute[1]
C’est surtout le “” que je ne comprends pas.
Peux-tu me l’expliquer S.T.P ?
Cela permet de tester si on a changé de minute sur la barre courante
Hello Nicolas, I do not now if this is the place to ask but I would like to ask you something. I am sure that for you it is very simple. I have a moving average in my charts. This MA changes color from red to green for an uptrend and green to red for a down trend.
I want to have code that covers the color change so that I, for example, can use it in a trading system. Like: go long if the MA turns green. Go shot if the MA turns red. Or use it in an allert. Can you help me in that?
Warmest regards and thanking you in advance.
Mert
This is not the right place, please open a new topic in ProOrder forum. This question has been answered many times, I’m sure you will find an answer by using our search engine (right under your avatar at the top right of the website or in the homepage).
Hello Nicolas great indicator, I use it on prorealtime, can I have a code version for Webank T3? Webank T3 uses proealcode language but I found some problems to generate your indicator thank you vero much
I think that it could work if you remove “style(histogram)” from the last line of the code.
Great work Nicolas! Thank you!
Hi Nicolas! This indicator is awesome! Can you help me to modify it a little bit…I want to get the Cumulative Delta on all loaded tick bars on a chart. And not to reset every X minutes. Something like this I found on PRC forum (but don’t provide the inside code): https://www.prorealcode.com/topic/cumulative-delta/
Can you add a code that fixes the cumulative period with a start/end time?
Yes that’s possible, please open a new topic in the indicators forum.
Come andrebbe modificato il codice se volessi calcolare il Cumulative Delta ogni X Ticks
That should be possible but with PRT v11.1
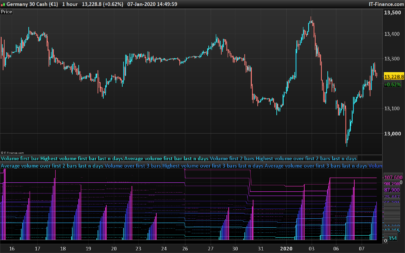
Hi Nicolas, I am trying to use your indicator on IGs Germany 30 DFB. I want to have the indicator calculate the cumulative delta for each minute and then reset. However the indicator doesn’t seem to consistently reset every minute, then length of time for each accumulation is variable and I have to reset the indicator if I want each block to be equal to 1 minute – this suggest it is working fine for historical data but has problems running in real time. Any ideas how to fix this as it is a really useful indicator otherwise
It depends if a tick is received at the exact time of 1 minute elapsed since the last one. If not, then a decay may arise.
Thanks for the quick response Nicholas. Would you have any idea how to resolve. Manually refreshing the indicator works but is not ideal. Its a shame because its potentially a very powerful tool.
Do you think adjusting the below code might help?
newperiod = minuteminute[1]
if newperiod then
count=count+1
endif
if count = iminutes then
count=0
volp=0
volm=0
endif
If the indicator requires a tick to come in the precise moment that 1 minute has elapsed perhaps a 5 second buffer either end of the minute might facilitate this? What would be the syntax to replace ‘minute’ int he above with ‘second’? I can only find ‘CurrentSecond’ which doesn’t seem to do the job.
There is no “second” instruction.