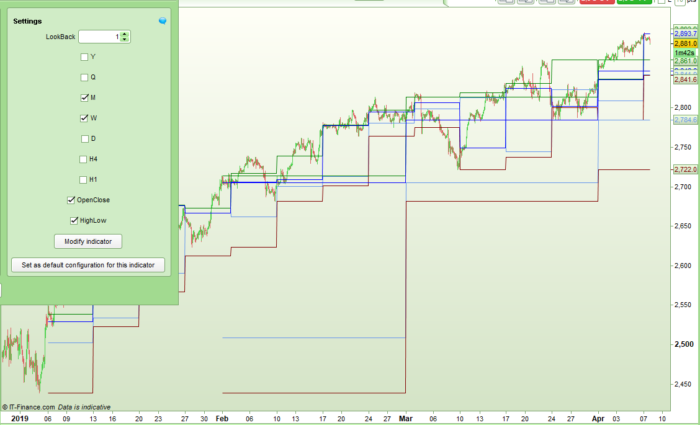
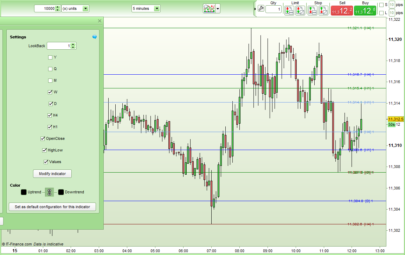
This indicator displays yearly, quarterly, monthly, weekly, daily, 4 hourly and 1 hourly OHLC (open, high, low and close) values on a price chart.
You can choose which OHLC values you want to display and also display just the high and low values or just the open and close values or all of them.
By changing the LookBack period you can display the OHLC values from any previous year, month week etc. When LookBack = 1 it displays on each candle values from the previous year, previous month, previous week etc. When LookBack = 2 it displays the values from two years ago, two months ago etc. With this feature if you add the indicator multiple times to your price chart you can for example display lines representing the last three months OHLC values.
The daily values are calculated starting at the open of the Monday candle to remove the issue of having Sunday OHLC values throughout Monday. You actually get the OHLC of Friday and Sunday combined shown on a Monday. The weekly values are calculated from the opening of the Sunday candle. If there is no Sunday or Monday candles then the week OHLC starts on whichever is the first trading day of that week.
The indicator can be used on any time frame chart but you have to have enough candles on a chart to display the values. The indicator has to be able to see a complete previous year from Jan 1st to Dec 31st before it can display any OHLC values for a year. The same for a month – it needs a whole month before it can display anything. Same for a week etc. It is not possible to display faster time frame OHLC values on a slower time frame chart. So you can’t have daily OHLC on a weekly chart for example.
It can be slow to draw if you want everything displayed on a lot of bars!
I suggest downloading the ITF file and importing it rather than cutting and pasting to ensure that you get full functionality.
Code written following the request made here: https://www.prorealcode.com/topic/conversion-tradingview-to-prorealtime-previous-ohlc/
|
1 2 3 4 5 6 7 8 9 10 11 12 13 14 15 16 17 18 19 20 21 22 23 24 25 26 27 28 29 30 31 32 33 34 35 36 37 38 39 40 41 42 43 44 45 46 47 48 49 50 51 52 53 54 55 56 57 58 59 60 61 62 63 64 65 66 67 68 69 70 71 72 73 74 75 76 77 78 79 80 81 82 83 84 85 86 87 88 89 90 91 92 93 94 95 96 97 98 99 100 101 102 103 104 105 106 107 108 109 110 111 112 113 114 115 116 117 118 119 120 121 122 123 124 125 126 127 128 129 130 131 132 133 134 135 136 137 138 139 140 141 142 143 144 145 146 147 148 149 150 151 152 153 154 155 156 157 158 159 160 161 162 163 164 165 166 167 168 169 170 171 172 173 174 175 176 177 178 179 180 181 182 183 184 185 186 187 188 189 190 191 192 193 194 195 196 197 198 199 200 201 202 203 204 205 206 207 208 209 210 211 212 213 214 215 216 217 218 219 220 221 222 223 224 225 226 227 228 229 230 231 232 233 234 235 236 237 238 239 240 241 242 243 244 245 246 247 248 249 250 251 252 253 254 255 256 257 258 259 260 261 262 263 264 265 266 267 268 269 270 271 272 273 274 275 276 |
//OHLC Y Q M W D H4 H1 v1.1 //Coded by Vonasi //20190412 //Settings //LookBack = 1 //Y = 0 //Q = 0 //M = 1 //W = 0 //D = 0 //H4 = 0 //H1 = 0 //OpenClose = 1 //HighLow = 1 //1 Hour if h1 then if openhour <> openhour[1] then h1index = h1index + 1 h1high = 0 h1low = close h1open = open h1close = close if h1index > lookback then for j = 1 to barindex if h1index[j] = h1index - lookback then myh1high = h1high[j] myh1low = h1low[j] myh1open = h1open[j] myh1close = h1close[j] break endif next endif endif h1high = max(h1high,high) h1low = min(h1low,low) h1close = close endif //4 Hour if h4 then if openhour <> openhour[1] and (openhour = 1 or openhour = 5 or openhour = 9 or openhour = 13 or openhour = 17 or openhour = 21) then h4index = h4index + 1 h4high = 0 h4low = close h4open = open h4close = close if h4index > lookback then for j = 1 to barindex if h4index[j] = h4index - lookback then myh4high = h4high[j] myh4low = h4low[j] myh4open = h4open[j] myh4close = h4close[j] break endif next endif endif h4high = max(h4high,high) h4low = min(h4low,low) h4close = close endif //Day if d then if openday <> openday[1] then dayindex = dayindex + 1 dayhigh = 0 daylow = close dayopen = open dayclose = close if dayindex > lookback then for j = 1 to barindex if dayindex[j] = dayindex - lookback then mydayhigh = dayhigh[j] mydaylow = daylow[j] mydayopen = dayopen[j] mydayclose = dayclose[j] break endif next endif endif dayhigh = max(dayhigh,high) daylow = min(daylow,low) dayclose = close endif //Week if w then if opendayofweek < opendayofweek[1] then weekindex = weekindex + 1 weekhigh = 0 weeklow = close weekopen = open weekclose = close if weekindex > lookback then for j = 1 to barindex if weekindex[j] = weekindex - lookback then myweekhigh = weekhigh[j] myweeklow = weeklow[j] myweekopen = weekopen[j] myweekclose = weekclose[j] break endif next endif endif weekhigh = max(weekhigh,high) weeklow = min(weeklow,low) weekclose = close endif //Month if m then if openmonth <> openmonth[1] then monthindex = monthindex + 1 monthhigh = 0 monthlow = close monthopen = open monthclose = close if monthindex > lookback then for j = 1 to barindex if monthindex[j] = monthindex - lookback then mymonthhigh = monthhigh[j] mymonthlow = monthlow[j] mymonthopen = monthopen[j] mymonthclose = monthclose[j] break endif next endif endif monthhigh = max(monthhigh,high) monthlow = min(monthlow,low) monthclose = close endif //Quarter if q then if openmonth <> openmonth[1] and (openmonth = 1 or openmonth = 4 or openmonth = 7 or openmonth = 10) then quarterindex = quarterindex + 1 quarterhigh = 0 quarterlow = close quarteropen = open quarterclose = close if quarterindex > lookback then for j = 1 to barindex if quarterindex[j] = quarterindex - lookback then myquarterhigh = quarterhigh[j] myquarterlow = quarterlow[j] myquarteropen = quarteropen[j] myquarterclose = quarterclose[j] break endif next endif endif quarterhigh = max(quarterhigh,high) quarterlow = min(quarterlow,low) quarterclose = close endif //Year if y then if openyear <> openyear[1] then yearindex = yearindex + 1 yearhigh = 0 yearlow = close yearopen = open yearclose = close if yearindex > lookback then for j = 1 to barindex if yearindex[j] = yearindex - lookback then myyearhigh = yearhigh[j] myyearlow = yearlow[j] myyearopen = yearopen[j] myyearclose = yearclose[j] break endif next endif endif yearhigh = max(yearhigh,high) yearlow = min(yearlow,low) yearclose = close endif //Remove zero value plotting at start and unwanted lines if h1index < lookback or not h1 or not openclose then myh1open = undefined myh1close = undefined endif if h1index < lookback or not h1 or not highlow then myh1high = undefined myh1low = undefined endif if h4index < lookback or not h4 or not openclose then myh4open = undefined myh4close = undefined endif if h4index < lookback or not h4 or not highlow then myh4high = undefined myh4low = undefined endif if dayindex < lookback or not d or not openclose then mydayopen = undefined mydayclose = undefined endif if dayindex < lookback or not d or not highlow then mydayhigh = undefined mydaylow = undefined endif if weekindex < lookback or not w or not openclose then myweekopen = undefined myweekclose = undefined endif if weekindex < lookback or not w or not highlow then myweekhigh = undefined myweeklow = undefined endif if monthindex < lookback or not m or not openclose then mymonthopen = undefined mymonthclose = undefined endif if monthindex < lookback or not m or not highlow then mymonthhigh = undefined mymonthlow = undefined endif if quarterindex < lookback or not q or not openclose then myquarteropen = undefined myquarterclose = undefined endif if quarterindex < lookback or not q or not highlow then myquarterhigh = undefined myquarterlow = undefined endif if yearindex < lookback or not y or not openclose then myyearopen = undefined myyearclose = undefined endif if yearindex < lookback or not y or not highlow then myyearhigh = undefined myyearlow = undefined endif return myweekopen coloured(100,149,237) as "Week Open", myweekhigh coloured(0,128,0) as "Week High", myweeklow coloured(128,0,0) as "Week Low", myweekclose coloured(0,0,255) as "Week Close", mymonthopen coloured(100,149,237) as "Month Open", mymonthhigh coloured (0,128,0) as "Month High", mymonthlow coloured (128,0,0) as "Month Low", mymonthclose coloured (0,0,255) as "Month Close",mydayopen coloured(100,149,237) as "Day Open", mydayhigh coloured (0,128,0) as "Day High", mydaylow coloured (128,0,0) as "Day Low", mydayclose coloured (0,0,255) as "Day Close", myyearopen coloured(100,149,237) as "Year Open", myyearhigh coloured (0,128,0) as "Year High", myyearlow coloured (128,0,0) as "Year Low", myyearclose coloured (0,0,255) as "Year Close", myquarteropen coloured(100,149,237) as "Quarter Open", myquarterhigh coloured (0,128,0) as "Quarter High", myquarterlow coloured (128,0,0) as "Quarter Low", myquarterclose coloured (0,0,255) as "Quarter Close", myh4open coloured(100,149,237) as "H4 Open", myh4high coloured (0,128,0) as "H4 High", myh4low coloured (128,0,0) as "H4 Low", myh4close coloured (0,0,255) as "H4 Close", myh1open coloured(100,149,237) as "H1 Open", myh1high coloured (0,128,0) as "H1 High", myh1low coloured (128,0,0) as "H1 Low", myh1close coloured (0,0,255) as "H1 Close" |
Share this
No information on this site is investment advice or a solicitation to buy or sell any financial instrument. Past performance is not indicative of future results. Trading may expose you to risk of loss greater than your deposits and is only suitable for experienced investors who have sufficient financial means to bear such risk.
ProRealTime ITF files and other attachments :
Find other exclusive trading pro-tools on ![]()
PRC is also on YouTube, subscribe to our channel for exclusive content and tutorials


Looks great. Thank you very much. I will test it during the next days!
Please note that there is a small bug in the indicator caused by a typo. Please delete ‘and openday[1] 7’ on line 75 (I’m not sure how it got there except for a cut and paste error!) Hopefully Nicolas will update the library post soon to remove this.
Everything seems to work very well. But I would still recommend to pre-check everything if you change the timeframe in your chart. This is the best and most reliable code for previous OHLC….Thanks again!
The typo on line 75 has now been corrected in this library post and a new v1.1 ITF file attached. Thanks for doing that Nicolas.
Thanks for this code but there is 4 different versions and i don’t know wich is the good one ?
I don’t understand. There is only one ITF file here not four. Download and import it. You might want to change line 75 to if opendayofweek opendayofweek[1] and opendayofweek 0 then as this means that small range Sunday bars are included in with Friday bars as per the description.
Ok i understand now… I make a confusion with a other code… Thanks Vonasi.
Hi Vonasi,
I thank you for your great indicator i’m using every day !
I tried to add a fonctionnality, but with no success.
My idea is to add a floating line (blue dotted) on the graph which indicates the next level prices are going to cross (daily, weekly, monthly,etc …)
For exemple, on the graph, under the actual price, the blue line indicate the next level prices will meet, that is the high of May 4th.
If prices crosses that level, the blue line disepears and is set on the 2sd level crossed, then on the 3rd, etc …
That way, I just have one blue line above and one blus line below price.
I hope I have been clear.
Thanks a lot for your help
Thierry
I can’t post an image. i don’t know how to do. Sorry
Lien vers mon image
[URL=https://www.casimages.com/i/200515043914185668.jpg.html][IMG]https://nsa40.casimages.com/img/2020/05/15/mini_200515043914185668.jpg[/IMG][/url]
That should be possible – I’ll add it to my list to work on!
Thanks a lot
Hi Vonasi, I love this indicator – good job! Just one question: If I want the monthly OHLC Lines in the daily timeframe, its (most of the time) 1 day to late, to switch the month. Example: It takes the dayclose from the Sept 01 as August monthly close instead the close from Aug 31th… what can I do, to avoid this error? Thanks in advance for your support! Cheers
Copy and paste this code, don’t work. error!