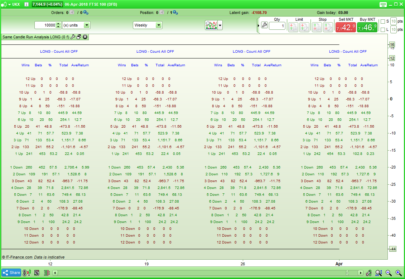
This indicator analyses candles in the past and then displays in a text format what has historically happened based on how the current candle is drawn.
It analyses every candle back to whatever start date you set and the win rate is calculated based on buying or selling at the open of the next candle and then selling at the close.
It analyses colour, highs and lows and every combination of them.
It returns short and long win rate results for:
- Candle colour – a green or red body.
- A higher high (HH) or lower high (LH) or higher low (HL) or lower low (LL) compared to the previous candle.
- Candles with a HH, LH, HL or LL with either green or red body.
- Candles with HH+HL, LH+LL, HH+LL or LH+HL.
- Candles with HH+HL, LH+LL, HH+LL or LH+HL with either a green or red body.
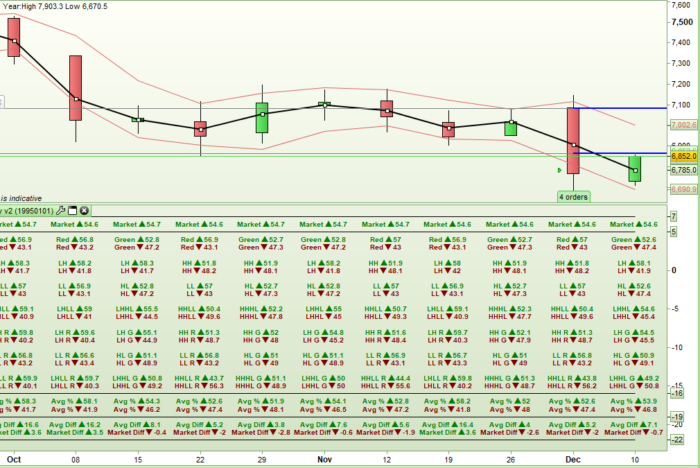
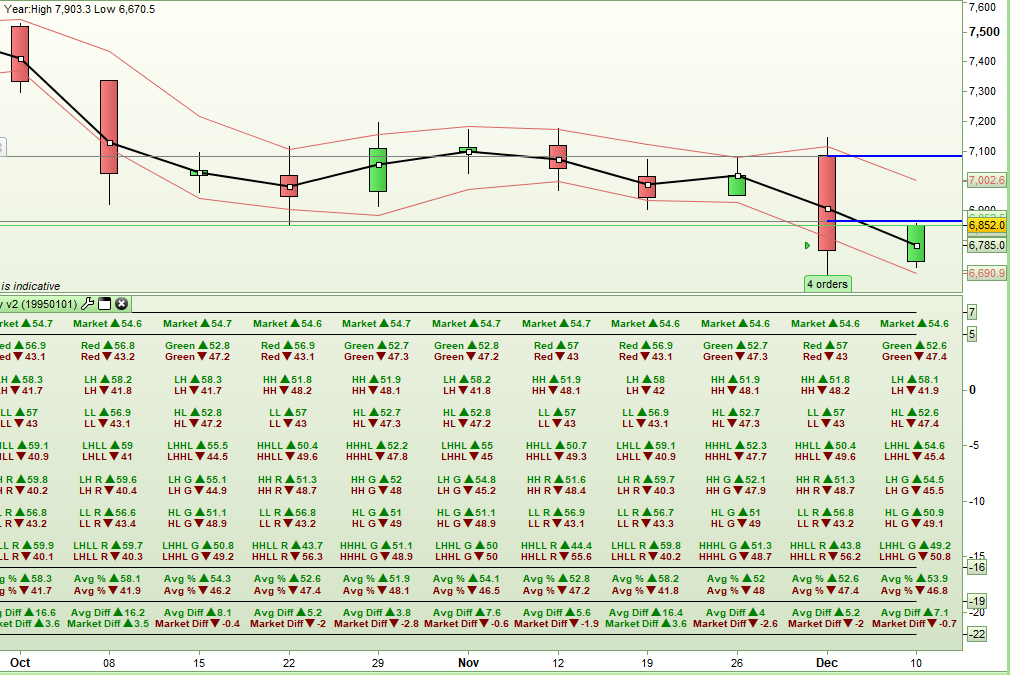
It checks the current candle and then displays below it the following data based on which of the above candle conditions are met:
- Market – the all time win rate if you bought at the open of every candle and sold at the close. It is shown as green if longs have been more successful and red if shorts have been more successful. This is our baseline probability to try to beat.
- The long win rate and short win rate for each of the possible combinations that fit the candle drawn above.
- The average long win rate and the average short win rate for all the results for the candle drawn above.
- The difference between the average win rates. The higher number is the highest probable direction of the next candle based on what has happened historically.
- The difference between the all time market win rate and the highest of the two long/short average win rates. A minus/red number indicates that the probability is not greater than the market norm and a higher/green number indicates that probability is greater than the market norm.
Obviously zoom in to see the indicator more clearly.
This indicator could be useful for checking on weekly and daily charts to get a feel for what might happen next but remember that what happened in the past may not necessarily repeat itself in the future! Also on indices where the trend is normally up the probability for short trades will always be low compared to long trades.
|
1 2 3 4 5 6 7 8 9 10 11 12 13 14 15 16 17 18 19 20 21 22 23 24 25 26 27 28 29 30 31 32 33 34 35 36 37 38 39 40 41 42 43 44 45 46 47 48 49 50 51 52 53 54 55 56 57 58 59 60 61 62 63 64 65 66 67 68 69 70 71 72 73 74 75 76 77 78 79 80 81 82 83 84 85 86 87 88 89 90 91 92 93 94 95 96 97 98 99 100 101 102 103 104 105 106 107 108 109 110 111 112 113 114 115 116 117 118 119 120 121 122 123 124 125 126 127 128 129 130 131 132 133 134 135 136 137 138 139 140 141 142 143 144 145 146 147 148 149 150 151 152 153 154 155 156 157 158 159 160 161 162 163 164 165 166 167 168 169 170 171 172 173 174 175 176 177 178 179 180 181 182 183 184 185 186 187 188 189 190 191 192 193 194 195 196 197 198 199 200 201 202 203 204 205 206 207 208 209 210 211 212 213 214 215 216 217 218 219 220 221 222 223 224 225 226 227 228 229 230 231 232 233 234 235 236 237 238 239 240 241 242 243 244 245 246 247 248 249 250 251 252 253 254 255 256 257 258 259 260 261 262 263 264 265 266 267 268 269 270 271 272 273 274 275 276 277 278 279 280 281 282 283 284 285 286 287 288 289 290 291 292 293 294 295 296 297 298 299 300 301 302 303 304 305 306 307 308 309 310 311 312 313 314 315 316 317 318 319 320 321 322 323 324 325 326 327 328 329 330 331 332 333 334 335 336 337 338 339 340 341 342 343 344 345 346 347 348 349 350 351 352 353 354 355 356 357 358 359 360 361 362 363 364 365 366 367 368 369 370 371 372 373 374 375 376 377 378 379 380 381 382 383 384 385 386 387 388 389 390 391 392 393 394 395 396 397 398 399 400 401 402 403 404 405 406 407 408 409 410 411 412 413 414 415 416 417 418 419 420 421 422 423 424 425 426 427 428 429 430 431 432 433 434 435 436 437 438 439 440 441 442 443 444 445 446 447 448 449 450 451 452 453 454 455 456 457 458 459 460 461 462 463 464 465 466 467 468 469 470 471 472 473 474 475 476 477 478 479 480 481 482 483 484 485 486 487 488 489 490 491 492 493 494 495 496 497 498 499 500 501 502 503 504 505 506 507 508 509 510 511 512 513 |
//Candlestick Probability // //By Vonasi //Created 20181211 // //StartDate = 19950101 hh = high[1] > high[2] ll = low[1] < low[2] hl = low[1] >= low[2] lh = high[1] <= high[2] g = close[1] > open[1] r = close [1] <= open[1] if date >= startdate then //HH if hh then hhcount = hhcount + 1 if close > open then hhlong = hhlong + 1 endif endif //LL if ll then llcount = llcount + 1 if close > open then lllong = lllong + 1 endif endif //LH if lh then lhcount = lhcount + 1 if close > open then lhlong = lhlong + 1 endif endif //HL if hl then hlcount = hlcount + 1 if close > open then hllong = hllong + 1 endif endif //HHHL if hh and hl then hhhlcount = hhhlcount + 1 if close > open then hhhllong = hhhllong + 1 endif endif //LHLL if lh and ll then lhllcount = lhllcount + 1 if close > open then lhlllong = lhlllong + 1 endif endif //HHLL if hh and ll then hhllcount = hhllcount + 1 if close > open then hhlllong = hhlllong + 1 endif endif //LHHL if lh and hl then lhhlcount = lhhlcount + 1 if close > open then lhhllong = lhhllong + 1 endif endif //HHG if hh and g then hhgcount = hhgcount + 1 if close > open then hhglong = hhglong + 1 endif endif //LLG if ll and g then llgcount = llgcount + 1 if close > open then llglong = llglong + 1 endif endif //LHG if lh and g then lhgcount = lhgcount + 1 if close > open then lhglong = lhglong + 1 endif endif //HLG if hl and g then hlgcount = hlgcount + 1 if close > open then hlglong = hlglong + 1 endif endif //HHR if hh and r then hhrcount = hhrcount + 1 if close > open then hhrlong = hhrlong + 1 endif endif //LLR if ll and r then llrcount = llrcount + 1 if close > open then llrlong = llrlong + 1 endif endif //LHR if lh and r then lhrcount = lhrcount + 1 if close > open then lhrlong = lhrlong + 1 endif endif //HLR if hl and r then hlrcount = hlrcount + 1 if close > open then hlrlong = hlrlong + 1 endif endif //HHHLG if hh and hl and g then hhhlgcount = hhhlgcount + 1 if close > open then hhhlglong = hhhlglong + 1 endif endif //LHLLG if lh and ll and g then lhllgcount = lhllgcount + 1 if close > open then lhllglong = lhllglong + 1 endif endif //HHLLG if hh and ll and g then hhllgcount = hhllgcount + 1 if close > open then hhllglong = hhllglong + 1 endif endif //LHHLG if lh and hl and g then lhhlgcount = lhhlgcount + 1 if close > open then lhhlglong = lhhlglong + 1 endif endif //HHHLR if hh and hl and r then hhhlrcount = hhhlrcount + 1 if close > open then hhhlrlong = hhhlrlong + 1 endif endif //LHLLR if lh and ll and r then lhllrcount = lhllrcount + 1 if close > open then lhllrlong = lhllrlong + 1 endif endif //HHLLR if hh and ll and r then hhllrcount = hhllrcount + 1 if close > open then hhllrlong = hhllrlong + 1 endif endif //LHHLR if lh and hl and r then lhhlrcount = lhhlrcount + 1 if close > open then lhhlrlong = lhhlrlong + 1 endif endif //G if g then gcount = gcount + 1 if close > open then glong = glong + 1 endif endif //R if r then rcount = rcount + 1 if close > open then rlong = rlong + 1 endif endif hhrate = round((hhlong/hhcount) * 1000) / 10 llrate = round((lllong/llcount) * 1000) / 10 lhrate = round((lhlong/lhcount) * 1000) / 10 hlrate = round((hllong/hlcount) * 1000) / 10 hhhlrate = round((hhhllong/hhhlcount) * 1000) / 10 lhllrate = round((lhlllong/lhllcount) * 1000) / 10 hhllrate = round((hhlllong/hhllcount) * 1000) / 10 lhhlrate = round((lhhllong/lhhlcount) * 1000) / 10 hhgrate = round((hhglong/hhgcount) * 1000) / 10 llgrate = round((llglong/llgcount) * 1000) / 10 hhrrate = round((hhrlong/hhrcount) * 1000) / 10 llrrate = round((llrlong/llrcount) * 1000) / 10 lhgrate = round((lhglong/lhgcount) * 1000) / 10 hlgrate = round((hlglong/hlgcount) * 1000) / 10 lhrrate = round((lhrlong/lhrcount) * 1000) / 10 hlrrate = round((hlrlong/hlrcount) * 1000) / 10 hhhlgrate = round((hhhlglong/hhhlgcount) * 1000) / 10 lhllgrate = round((lhllglong/lhllgcount) * 1000) / 10 hhllgrate = round((hhllglong/hhllgcount) * 1000) / 10 lhhlgrate = round((lhhlglong/lhhlgcount) * 1000) / 10 hhhlrrate = round((hhhlrlong/hhhlrcount) * 1000) / 10 lhllrrate = round((lhllrlong/lhllrcount) * 1000) / 10 hhllrrate = round((hhllrlong/hhllrcount) * 1000) / 10 lhhlrrate = round((lhhlrlong/lhhlrcount) * 1000) / 10 grate = round((glong/gcount) * 1000) / 10 rrate = round((rlong/rcount) * 1000) / 10 shhrate = 100 - hhrate sllrate = 100 - llrate slhrate = 100 - lhrate shlrate = 100 - hlrate shhhlrate = 100 - hhhlrate slhllrate = 100 - lhllrate shhllrate = 100 - hhllrate slhhlrate = 100 - lhhlrate shhgrate = 100 - hhgrate sllgrate = 100 - llgrate shhrrate = 100 - hhrrate sllrrate = 100 - llrrate slhgrate = 100 - lhgrate shlgrate = 100 - hlgrate slhrrate = 100 - lhrrate shlrrate = 100 - hlrrate shhhlgrate = 100 - hhhlgrate slhllgrate = 100 - lhllgrate shhllgrate = 100 - hhllgrate slhhlgrate = 100 - lhhlgrate shhhlrrate = 100 - hhhlrrate slhllrrate = 100 - lhllrrate shhllrrate = 100 - hhllrrate slhhlrrate = 100 - lhhlrrate sgrate = 100 - grate srrate = 100 - rrate marketcount = marketcount + 1 if close > open then marketlong = marketlong + 1 endif marketrate = round((marketlong/marketcount) * 1000) / 10 endif hhnow = high > high[1] llnow = low < low[1] hlnow = low > low[1] lhnow = high < high[1] gnow = close > open rnow = close < open if marketrate >= 50 then DRAWTEXT("Market ▲#marketrate#", barindex, 6, SansSerif,Bold,10) COLOURED(0,128,0) else DRAWTEXT("Market ▼#marketrate#", barindex, 6, SansSerif,Bold,10) COLOURED(128,0,0) endif uptotal = 0 downtotal = 0 if gnow then DRAWTEXT("Green ▲#grate#", barindex, 4, SansSerif,Bold,10) COLOURED(0,128,0) uptotal = uptotal + grate DRAWTEXT("Green ▼#sgrate#", barindex, 3, SansSerif,Bold,10) COLOURED(128,0,0) downtotal = downtotal + sgrate endif if rnow then DRAWTEXT("Red ▲#rrate#", barindex, 4, SansSerif,Bold,10) COLOURED(0,128,0) uptotal = uptotal + rrate DRAWTEXT("Red ▼#srrate#", barindex, 3, SansSerif,Bold,10) COLOURED(128,0,0) downtotal = downtotal + srrate endif if hhnow then DRAWTEXT("HH ▲#hhrate#", barindex, 1, SansSerif,Bold,10) COLOURED(0,128,0) uptotal = uptotal + hhrate DRAWTEXT("HH ▼#shhrate#", barindex, 0, SansSerif,Bold,10) COLOURED(128,0,0) downtotal = downtotal + shhrate endif if lhnow then DRAWTEXT("LH ▲#lhrate#", barindex, 1, SansSerif,Bold,10) COLOURED(0,128,0) uptotal = uptotal + lhrate DRAWTEXT("LH ▼#slhrate#", barindex, 0, SansSerif,Bold,10) COLOURED(128,0,0) downtotal = downtotal + slhrate endif if llnow then DRAWTEXT("LL ▲#llrate#", barindex, -2, SansSerif,Bold,10) COLOURED(0,128,0) uptotal = uptotal + llrate DRAWTEXT("LL ▼#sllrate#", barindex, -3, SansSerif,Bold,10) COLOURED(128,0,0) downtotal = downtotal + sllrate endif if hlnow then DRAWTEXT("HL ▲#hlrate#", barindex, -2, SansSerif,Bold,10) COLOURED(0,128,0) uptotal = uptotal + hlrate DRAWTEXT("HL ▼#shlrate#", barindex, -3, SansSerif,Bold,10) COLOURED(128,0,0) downtotal = downtotal + shlrate endif if hhnow and hlnow then DRAWTEXT("HHHL ▲#hhhlrate#", barindex, -5, SansSerif,Bold,10) COLOURED(0,128,0) uptotal = uptotal + hhhlrate DRAWTEXT("HHHL ▼#shhhlrate#", barindex, -6, SansSerif,Bold,10) COLOURED(128,0,0) downtotal = downtotal + shhhlrate endif if lhnow and llnow then DRAWTEXT("LHLL ▲#lhllrate#", barindex, -5, SansSerif,Bold,10) COLOURED(0,128,0) uptotal = uptotal + lhllrate DRAWTEXT("LHLL ▼#slhllrate#", barindex, -6, SansSerif,Bold,10) COLOURED(128,0,0) downtotal = downtotal + slhllrate endif if hhnow and llnow then DRAWTEXT("HHLL ▲#hhllrate#", barindex, -5, SansSerif,Bold,10) COLOURED(0,128,0) uptotal = uptotal + hhllrate DRAWTEXT("HHLL ▼#shhllrate#", barindex, -6, SansSerif,Bold,10) COLOURED(128,0,0) downtotal = downtotal + shhllrate endif if lhnow and hlnow then DRAWTEXT("LHHL ▲#lhhlrate#", barindex, -5, SansSerif,Bold,10) COLOURED(0,128,0) uptotal = uptotal + lhllrate DRAWTEXT("LHHL ▼#slhhlrate#", barindex, -6, SansSerif,Bold,10) COLOURED(128,0,0) downtotal = downtotal + slhhlrate endif if hhnow and gnow then DRAWTEXT("HH G ▲#hhgrate#", barindex, -8, SansSerif,Bold,10) COLOURED(0,128,0) uptotal = uptotal + hhgrate DRAWTEXT("HH G ▼#shhgrate#", barindex, -9, SansSerif,Bold,10) COLOURED(128,0,0) downtotal = downtotal + shhgrate endif if hhnow and rnow then DRAWTEXT("HH R ▲#hhrrate#", barindex, -8, SansSerif,Bold,10) COLOURED(0,128,0) uptotal = uptotal + hhrrate DRAWTEXT("HH R ▼#shhrrate#", barindex, -9, SansSerif,Bold,10) COLOURED(128,0,0) downtotal = downtotal + shhrrate endif if lhnow and gnow then DRAWTEXT("LH G ▲#lhgrate#", barindex, -8, SansSerif,Bold,10) COLOURED(0,128,0) uptotal = uptotal + lhgrate DRAWTEXT("LH G ▼#slhgrate#", barindex, -9, SansSerif,Bold,10) COLOURED(128,0,0) downtotal = downtotal + slhgrate endif if lhnow and rnow then DRAWTEXT("LH R ▲#lhrrate#", barindex, -8, SansSerif,Bold,10) COLOURED(0,128,0) uptotal = uptotal + lhrrate DRAWTEXT("LH R ▼#slhrrate#", barindex, -9, SansSerif,Bold,10) COLOURED(128,0,0) downtotal = downtotal + slhrrate endif if llnow and gnow then DRAWTEXT("LL G ▲#llgrate#", barindex, -11, SansSerif,Bold,10) COLOURED(0,128,0) uptotal = uptotal + llgrate DRAWTEXT("LL G ▼#sllgrate#", barindex, -12, SansSerif,Bold,10) COLOURED(128,0,0) downtotal = downtotal + sllgrate endif if llnow and rnow then DRAWTEXT("LL R ▲#llrrate#", barindex, -11, SansSerif,Bold,10) COLOURED(0,128,0) uptotal = uptotal + llrrate DRAWTEXT("LL R ▼#sllrrate#", barindex, -12, SansSerif,Bold,10) COLOURED(128,0,0) downtotal = downtotal + sllrrate endif if hlnow and gnow then DRAWTEXT("HL G ▲#hlgrate#", barindex, -11, SansSerif,Bold,10) COLOURED(0,128,0) uptotal = uptotal + hlgrate DRAWTEXT("HL G ▼#shlgrate#", barindex, -12, SansSerif,Bold,10) COLOURED(128,0,0) downtotal = downtotal + shlgrate endif if hlnow and rnow then DRAWTEXT("HL R ▲#hlrrate#", barindex, -11, SansSerif,Bold,10) COLOURED(0,128,0) uptotal = uptotal + hlrrate DRAWTEXT("HL R ▼#shlrrate#", barindex, -12, SansSerif,Bold,10) COLOURED(128,0,0) downtotal = downtotal + shlrrate endif if hhnow and hlnow and gnow then DRAWTEXT("HHHL G ▲#hhhlgrate#", barindex, -14, SansSerif,Bold,10) COLOURED(0,128,0) uptotal = uptotal + hhhlgrate DRAWTEXT("HHHL G ▼#shhhlgrate#", barindex, -15, SansSerif,Bold,10) COLOURED(128,0,0) downtotal = downtotal + shhhlgrate endif if lhnow and llnow and gnow then DRAWTEXT("LHLL G ▲#lhllgrate#", barindex, -14, SansSerif,Bold,10) COLOURED(0,128,0) uptotal = uptotal + lhllgrate DRAWTEXT("LHLL G ▼#slhllgrate#", barindex, -15, SansSerif,Bold,10) COLOURED(128,0,0) downtotal = downtotal + slhllgrate endif if hhnow and llnow and gnow then DRAWTEXT("HHLL G ▲#hhllgrate#", barindex, -14, SansSerif,Bold,10) COLOURED(0,128,0) uptotal = uptotal + hhllgrate DRAWTEXT("HHLL G ▼#shhllgrate#", barindex, -15, SansSerif,Bold,10) COLOURED(128,0,0) downtotal = downtotal + shhllgrate endif if lhnow and hlnow and gnow then DRAWTEXT("LHHL G ▲#lhhlgrate#", barindex, -14, SansSerif,Bold,10) COLOURED(0,128,0) uptotal = uptotal + lhhlgrate DRAWTEXT("LHHL G ▼#slhhlgrate#", barindex, -15, SansSerif,Bold,10) COLOURED(128,0,0) downtotal = downtotal + slhhlgrate endif if hhnow and hlnow and rnow then DRAWTEXT("HHHL R ▲#hhhlrrate#", barindex, -14, SansSerif,Bold,10) COLOURED(0,128,0) uptotal = uptotal + hhhlrrate DRAWTEXT("HHHL R ▼#shhhlrrate#", barindex, -15, SansSerif,Bold,10) COLOURED(128,0,0) downtotal = downtotal + shhhlrrate endif if lhnow and llnow and rnow then DRAWTEXT("LHLL R ▲#lhllrrate#", barindex, -14, SansSerif,Bold,10) COLOURED(0,128,0) uptotal = uptotal + lhllrrate DRAWTEXT("LHLL R ▼#slhllrrate#", barindex, -15, SansSerif,Bold,10) COLOURED(128,0,0) downtotal = downtotal + slhllrrate endif if hhnow and llnow and rnow then DRAWTEXT("HHLL R ▲#hhllrrate#", barindex, -14, SansSerif,Bold,10) COLOURED(0,128,0) uptotal = uptotal + hhllrrate DRAWTEXT("HHLL R ▼#shhllrrate#", barindex, -15, SansSerif,Bold,10) COLOURED(128,0,0) downtotal = downtotal + shhllrrate endif if lhnow and hlnow and rnow then DRAWTEXT("LHHL R ▲#lhhlrrate#", barindex, -14, SansSerif,Bold,10) COLOURED(0,128,0) uptotal = uptotal + lhhlrrate DRAWTEXT("LHHL R ▼#slhhlrrate#", barindex, -15, SansSerif,Bold,10) COLOURED(128,0,0) downtotal = downtotal + slhhlrrate endif upavg = round((uptotal / 7) * 10) / 10 downavg = round((downtotal / 7) * 10) / 10 DRAWTEXT("Avg % ▲#upavg#", barindex, -17, SansSerif,Bold,10) COLOURED(0,128,0) DRAWTEXT("Avg % ▼#downavg#", barindex, -18, SansSerif,Bold,10) COLOURED(128,0,0) if upavg > downavg then Difference = (upavg - downavg) DRAWTEXT("Avg Diff ▲#difference#", barindex, -20, SansSerif,Bold,10) COLOURED(0,128,0) marketdiff = (upavg - marketrate) else Difference = (downavg - upavg) DRAWTEXT("Avg Diff ▼#difference#", barindex, -20, SansSerif,Bold,10) COLOURED(128,0,0) marketdiff = (downavg - marketrate) endif if marketdiff > 0 then DRAWTEXT("Market Diff ▲#marketdiff#", barindex, -21, SansSerif,Bold,10) COLOURED(0,128,0) else DRAWTEXT("Market Diff ▼#marketdiff#", barindex, -21, SansSerif,Bold,10) COLOURED(128,0,0) endif return 5, 7, -16, -19, -22 |
Share this
No information on this site is investment advice or a solicitation to buy or sell any financial instrument. Past performance is not indicative of future results. Trading may expose you to risk of loss greater than your deposits and is only suitable for experienced investors who have sufficient financial means to bear such risk.
ProRealTime ITF files and other attachments :PRC is also on YouTube, subscribe to our channel for exclusive content and tutorials



Very interesting indicator, it could be the basis of an AI system…no kidding.
Eres Grande¡¡¡…muchas Gracias.
Hola
Me parece muy interesante lo que has hecho, yo estoy queria hacer una estadistica similar, pero tengo problemas con el código. ¿podrias ayudarme?
I can’t help in Spanish! Maybe it is better to start a topic in the forums with your questions.
Hi Vonasi, great work! But what I do not understand is that the statistics change according to the number of bars you load. Would you have any explanation ? Thank you
Hi https://www.prorealcode.com/user/vonasi/ I am interested in in scanning for a similar setup where I want to find the HH & HL being formed for swing trading (not for individual candles). Similar for LH & LL for a down trend. Is there a readymade example I can have a look at? Thanks in advance – I am just learning so not sure if I am asking the right question 🙂
Minor Bug Fix Please download an updated version with a minor bug fix from here: https://www.prorealcode.com/topic/candlestick-probability-indicator-minor-bug-fix/