This break out analysis tool allows us to set a look back period (p) and then analyses breakouts of that periods highest high and lowest low in the next p bars. It can then return the results in three formats.:
- The quantity of breakouts and their conclusion.
- The percentage of breakouts and then the percentage of their conclusions.
- The Profit/Loss if you had gone long or short at a break out price and then sold at the end of the p long period.
In the percentage return ‘% green datum’ and ‘% red datum’ are the percentage of ups or downs when comparing close to open of the p test period. So for example if p = 7 then how many 7 bar periods end up or end down. This is just to give us a market datum to compare to.
It is possible to add or subtract a percentage to the highest high and lowest low breakout levels by changing the ‘Percent’ variable.
It is also possible to include a fixed spread in the profit and loss calculations by changing the ‘Spread’ variable.
Turn on and off the displayed lines for percentage, profit and loss and quantities using the tick boxes to make the output easier to read.
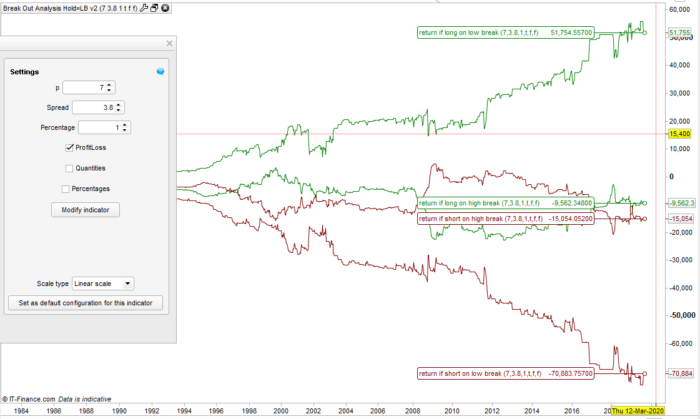
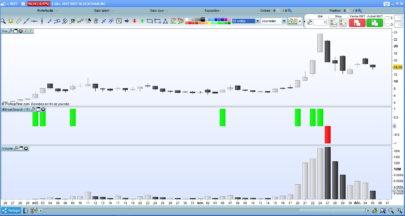
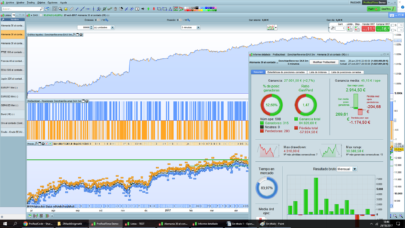
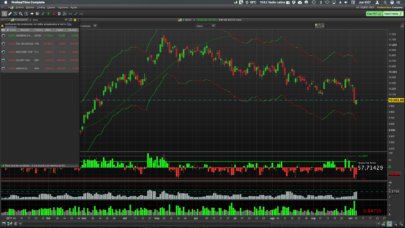
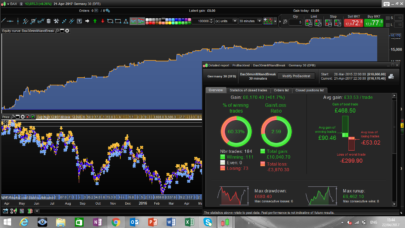
So for example in the images attached we can see that on the DJI daily if we set our p to 7 days then it checks for breakouts of the highest high and lowest low of every seven day period in the seven days following that period. It then simulates profit/loss if you closed the trade at the end of that seven day period.
10485 sets of data were analysed and there were 5756 breakouts in the test. 3239 breaks of the highest high (31% of the time) and 2517 breaks of the lowest low (24% of the time).
Our green datum is 57% and our red datum is 43% meaning that if at anytime we had just gone long then we would have been right 57% of the time at the end of the 7 days and wrong 43% of the time.
58% of the time a low break resulted in the closing price being higher than the break price at the end of the seven days.
If you had been going short at every 7 day high break price and expecting it to close below the low break price then you would have only been successful 0.03% of the time.
57% of low breaks close somewhere between the low break price and the high break price. Only 1% of the time is a low break price hit and then the close is above the high break price.
If you had been going long at the low break price of every seven day period and sold at the end of the following 7 day period then you would have a profit of £51755 with a 3.8 spread.
If you had been going short at the low break price of every seven day period and sold at the end of the following 7 day period then you would have a loss of £70884.
Obviously there is a lot more information but the above highlights some of the stand out analysis.
Hopefully this break out analysis tool can help us understand each instruments characteristics and increase our probability of trading in the most profitable direction at a break out.
I suggest downloading and importing the ITF file to get full functionality.
|
1 2 3 4 5 6 7 8 9 10 11 12 13 14 15 16 17 18 19 20 21 22 23 24 25 26 27 28 29 30 31 32 33 34 35 36 37 38 39 40 41 42 43 44 45 46 47 48 49 50 51 52 53 54 55 56 57 58 59 60 61 62 63 64 65 66 67 68 69 70 71 72 73 74 75 76 77 78 79 80 81 82 83 84 85 86 87 88 89 90 91 92 93 94 95 96 97 98 99 100 101 102 103 104 105 106 107 108 109 110 111 112 113 114 115 116 117 118 119 120 121 122 123 124 125 126 127 128 129 130 131 132 133 134 135 136 137 138 139 140 |
//Break Out Analysis Tool Hold = Lookback v2 //By Vonasi //20190828 //p = 3 //Spread = 0 //Percentage = 0 //Profitloss = 0 //Quantities = 0 //Percentages = 0 hh = highest[p](high[p]) * (1 + (percentage/100)) ll = lowest[p](low[p]) * (1 - (percentage/100)) myopen = open[p-1] hhao = highest[p](high) llao = lowest[p](low) if barindex > p * 2 then count = count + 1 if hhao > hh then hb = hb + 1 if close < hh and close > ll then hbci = hbci + 1 endif if close > hh then hbcah = hbcah + 1 endif if close < ll then hbcbl = hbcbl + 1 endif if close < hh then hbcbh = hbcbh + 1 endif longhb = longhb + (close - hh)-spread shorthb = shorthb + (hh - close)-spread endif if llao < ll then lb = lb + 1 if close < hh and close > ll then lbci = lbci + 1 endif if close < ll then lbcbl = lbcbl + 1 endif if close > hh then lbcah = lbcah + 1 endif if close > ll then lbcal = lbcal + 1 endif longlb = longlb + (close - ll)-spread shortlb = shortlb + (ll - close)-spread endif if close > myopen then green = green + 1 endif if close < myopen then red = red + 1 endif endif if not percentages then greenperc = undefined redperc = undefined hbperc = undefined lbperc = undefined hbciperc = undefined lbciperc = undefined hbcblperc = undefined hbcahperc = undefined lbcblperc = undefined lbcahperc = undefined hbcbhperc = undefined hbcbhperc = undefined lbcalperc = undefined lbcalperc = undefined else greenperc = (green/count)*100 redperc = (red/count)*100 hbperc = (hb/count)*100 lbperc = (lb/count)*100 hbciperc = (hbci/hb)*100 lbciperc = (lbci/lb)*100 hbcblperc = (hbcbl/hb)*100 hbcahperc = (hbcah/hb)*100 lbcblperc = (lbcbl/lb)*100 lbcahperc = (lbcah/lb)*100 hbcbhperc = (hbcbh/hb)*100 hbcbhperc = (hbcbh/hb)*100 lbcalperc = (lbcal/lb)*100 lbcalperc = (lbcal/lb)*100 endif //endif if not profitloss then rlonglb = undefined rlonghb = undefined rshortlb = undefined rshorthb = undefined else rlonglb = longlb rlonghb = longhb rshortlb = shortlb rshorthb = shorthb endif if not quantities then rcount = undefined rhb = undefined rlb = undefined rhbci = undefined rlbci = undefined rhbcbl = undefined rhbcah = undefined rlbcah = undefined rlbcbl = undefined rhbcbh = undefined rlbcal = undefined rbtot = undefined else rcount = count rhb = hb rlb = lb rhbci = hbci rlbci = lbci rhbcbl = hbcbl rhbcah = hbcah rlbcal = lbcah rlbcbl = lbcbl rhbcbh = hbcbh rlbcal = lbcal rbtot = hb + lb endif return greenperc coloured(0,128,0) as "% green datum" , redperc coloured(128,0,0) as "% red datum", hbperc as "% of times there is a high break out", lbperc as "% of times there is a a low break out", hbcahperc as "% of high break outs that close above high", lbcahperc as "% of low break outs that close above high", hbciperc as "% of high break outs that close inside", lbciperc as "% of low break outs that close inside", hbcblperc as "% of high break outs that close below low", lbcblperc as "% of low break outs that close below low", rlonghb coloured(0,128,0) as "return if long on high break", rshorthb coloured(128,0,0) as "return if short on high break", rlonglb coloured(0,128,0) as "return if long on low break", rshortlb coloured(128,0,0) as "return if short on low break", hbcbhperc as "% of high break outs that close below high", lbcalperc as "% of low break outs that close above low", rcount as "total qty analysed", rhb as "qty of high breaks", rlb as "qty of low breaks", rhbci as "qty of high break outs that close inside", rlbci as "qty of low break outs that close inside", rhbcbl as "qty of high break outs that close below low", rhbcah as "qty of high break outs that close above high", rlbcah as "qty of low break outs that close above high", rlbcbl as "qty of low break outs that close below low", rhbcbh as "qty of high breaks that close below high", rlbcal as "qty of low breaks that close above low", rbtot as "qty of break outs" |
Share this
No information on this site is investment advice or a solicitation to buy or sell any financial instrument. Past performance is not indicative of future results. Trading may expose you to risk of loss greater than your deposits and is only suitable for experienced investors who have sufficient financial means to bear such risk.
ProRealTime ITF files and other attachments :
Find other exclusive trading pro-tools on ![]()
PRC is also on YouTube, subscribe to our channel for exclusive content and tutorials


Vonasi, is it possible to have a screenshot of an index chart (eg djia) and below the breakout analysis tool result? Maybe with your comment on statistical metrics? Great job!
I can’t add any images here now that the library post has been listed. Perhaps you could start a topic in the forums to start a discussion on the breakout characteristics of various markets.
Hi Vonasi,
is there a reason why it does not work anymore in new version ePRT Platform? thank’s in advance
Thanks again Vonasi !
Thank you, this is a great tool @Vonasi, especially for those that used to like shorting Indices!
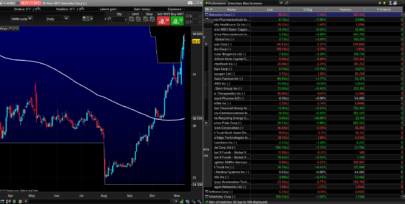
Better have great entry timing or else (monthly breakout on DIA)… https://www.dropbox.com/s/x7v41p4cuz4xrq5/mkt%20temperature.png