Average (Daily) Range

Average (Daily) Range

Hello all,

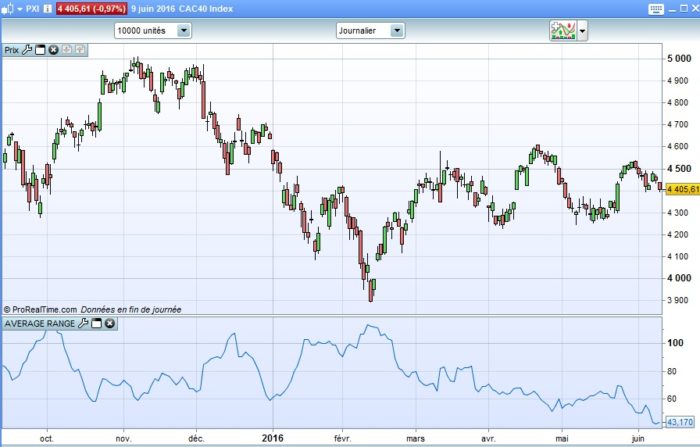
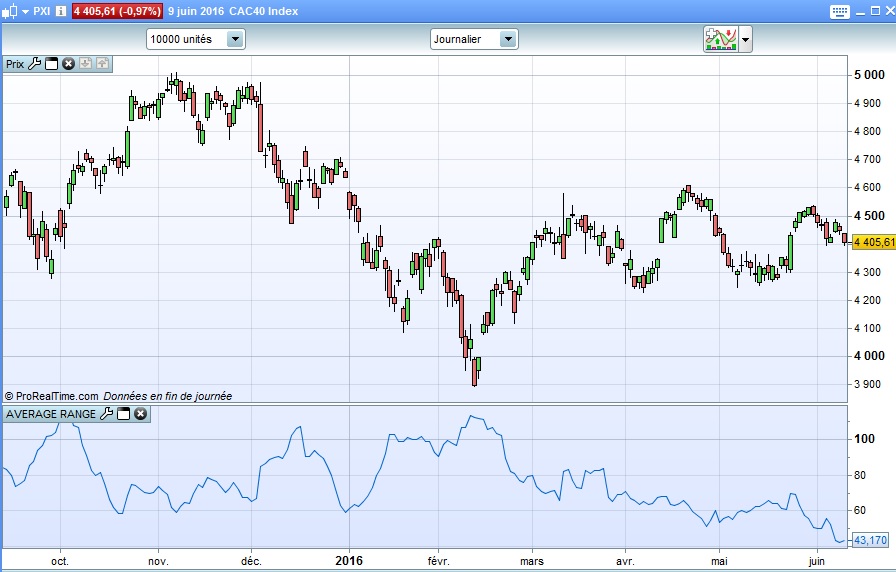
I was very surprised that I couln’t find the “Average Daily Range” indicator, although it is a very simple and important one.

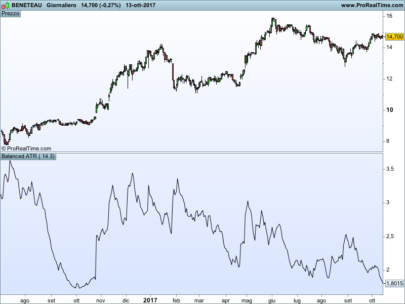
This simplified code can draw the ADR, but can also be applied to any timeframe.
So it would be the average range of the “p” last bars.

Beware, it is not the Average True Range.

Share this

Risk disclosure:

No information on this site is investment advice or a solicitation to buy or sell any financial instrument. Past performance is not indicative of future results. Trading may expose you to risk of loss greater than your deposits and is only suitable for experienced investors who have sufficient financial means to bear such risk.

ProRealTime ITF files and other attachments : How to import ITF files into ProRealTime platform?

PRC is also on YouTube, subscribe to our channel for exclusive content and tutorials

  1. David • 06/10/2016 #

    Hi Doc. Thanks for sharing. To me there’s isn’t much difference between this and the ATR and your code is not set for “daily” unless you use the daily chart?
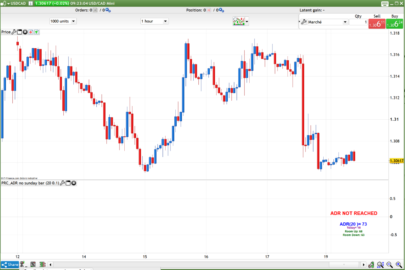
    I’m looking at developing the Average Daily Range to use on lower time-frames like I did here for the Moving Average Daily here: http://www.prorealcode.com/topic/daily-moving-average-with-customclose-on-non-daily-timeframe/#post-18761 
    I might try to make it during the holidays but thought you might be interested in making it the meantime if you have free time. 

    • Nicolas • 06/10/2016 #

      Hi David, this code is not the proper daily ATR, which is calculated as follow according to the probuilder documentation: 
      True range is the highest data in absolute value among :
      (today’s high – today’s low)
      (today’s high – yesterday’s close)
      (today’s low – yesterday’s close)
      To calculate the Average True Range, it is necessary to apply a Wilder moving average of the True Range.
      The code should be:
      period = 14

      //True range calculation
      d1 = Dhigh(0)-Dlow(0)
      d2 = abs(Dhigh(0)-Dclose(1))
      d3 = abs(Dlow(0)-Dclose(1))

      dailyTR =max(d1,max(d2,d3))

      c = wilderaverage[period](dailyTR)

      RETURN c as \"Daily Timeframe ATR\"
      But there is still a problem to calculate the Wilder Average of daily values array into a lower timeframe.. Understand, that this code don’t give you the good value because in this case the WilderAverage of 14 periods use the last 14 candlesticks of the timeframe on which the indicator is attached, not the last 14 daily values.

  2. David • 06/10/2016 #

    Thanks for the explanation Nicolas.

  3. freecat1899 • 06/10/2016 #

    Hello, I wanted to create a percent ADR based on this indicator, so I wrote this code that IMO it looks ok:

    // AVERAGE DAILY RANGE PERCENTAGE

    PMAXAVG = average[p](high)
    PMINAVG = average[p](low)
    PAVG = average [p] (close)
    ADRP = (PMAXAVG – PMINAVG)/PAVG*100

    return ADRP as “Average Daily Range Percent”

    However, when I use it, it doesn’t seem to give out correct values as it is giving me a higher value than the ATRP described in this post for the same 20 daily periods:

    https://www.prorealcode.com/prorealtime-indicators/average-true-range-percent-atrp/#:~:text=The%20Average%20True%20Range%20Percent,variation%20and%20not%20prices%20itselves.

    From my understanding of ADRP and ATRP, ADRP should always be lower than ATRP as it doesn’t include gaps.

    Can someone help me out? thanks

  4. revstrat • 06/10/2016 #

    At first glance, I see this mistake. You shouldn’t average the highs and the lows. You should be averaging the ranges.

avatar
Register or

Likes

avatar avatar avatar avatar
Related users ' posts
Caribeengeek Bonjour j’avais vu que vous proposiez d’écrire des codes pour ceux qui s’y connaisse pas Mai...
Caribeengeek Les devises unité
Nicolas Merci d'utiliser le forum pour les demandes de programmation personnalisée
ullle73 nicolas, can you somehome make this to be in the background of the price chart?
jonpt88 none did that yet right?
Nicolas You can ask for a code modification on forums, please open a new topic with your request.
Nicolas
6 years ago
Trinity Impulse
Trinity Impulse
5
Indicators
ribou ah d'accord merci beaucoup
domenico nlevel1 non modifica la curva al variare del suo valore
tiger_man_no1 Very nice ; what is the best period input date for DAILY CHART ?
JanWd Tried the code, nice concept, seems to work quit well for US/EUR 2hrs, Other markets seems n...
JR1976 Simple and nice code , congrats !!! Seems work well with TIme frame 1 h
phanz Hi all, Sorry revisiting an old post. This algo is simple, and simplicity is the ultimate ...
poonsl2828 Hi! Francesco I have test it on GBP/USD but it only have a trade on 9 Jun which i backtes...
ullle73 why not use 1h chart? has 95% hitrate
ullle73 i see most of positions are only 1 pip before exit?
Jean-Pierre Poulain When I buy and when I sell ?
Nicolas The featured image of the post do not deserve the indicator you are right, I attached other ...
Nicolas It is described in the post already :) The BUY/SELL signals are quite similar of what you ca...
imokdesign Hi Everybody, when I look at the strategy I felt the need to implement a Moneymanagement-Sy...
Inertia newlevel then multiplier=multiplier+1 oldlevel=newlevel newlevel=strategyprofit+startequi...
Inertia Hi Bjoern, I was playing around with your code this morning (EUR/USD 5'). Thank you to the...
fabio407 Thanks, Nicolas. Very useful. Would you tell me where to find what result conveys the functi...
Nicolas This is not an instruction of the programming language but a variable from this indicator (l...
fabio407 OK. I didn't notice it. Many thanks, Nicolas!
albertocampagna Sei grande Nicolas :-)
SAcht Dear Nicolas, Great work, thank you very much!I would love to use the indicator in ProScree...
SAcht btw: The above-posted ProScreener is supposed to show stocks for which the center line has i...
Wilko And not only readable.... makes it much easier to iterate different entry/exit-conditions, d...
IGOSNELL Hi Interesting strategy, when I used $ M-R Dif EURUSD M15 Long if does not enter any positi...
ilvillans HI, I modified the system, from good results but from this error: Replace the variables wit...
victormork Hi, I would just like to share my own take on this strategy. I'm using 30 min on EURUSD but ...
mckubik Thanks. I will run a Test. 
poonsl2828 Hi! bjoern May i know what timing should i change for time zone (Singapore (GMT +8:00) ...
Nicolas si il n'y a pas de stoploss définit dans le code, alors c'est normal :)
bertrandpinoy bonjour merci pour la réponse. Oui b sur ... est il possible que le SL soit coder sous une a...
Nicolas ok mais pourquoi poser la question ici ? Pour des questions non spécifique à cette article, ...
julien1978 The ADR value that is plotted intraday does not match the value of the regular ATR indicator...
Fab666 I've tried to get a fix for this also but no luck, it doesn't print the correct data as far ...
Seabiscuit Hi! With the new PRT update, this indicator does not work anymore
Guibourse Hi ! I am asking once again for your help : would it be possible to use the ATR as a "take p...
Tradingrob Many thanks for the indicator, however if the price is below the indicator, then the indicat...
aldtrading Merci pour ton travail ! J'ai de bons résultats en utilisant cet indicateur
zilliq Be careful, It works only if you are in daily timeframe, and on your graphic you are on hou...
DerPat I guess you are right, like always. If you change n to 24 you have at least the hours of a d...
gabri DerPat, you can also change line1 to read as follow to adapt this script to hourly timefram...
Doctrading Hello,  The strategy should be improved, no doubt. But it was just one of my ideas, which h...
ALEALE Yes Nicolas is very difficult, macro economic data can destroy any work!!  
styrke depends which.. I personally think that it's much more easier to trade on XBTUSD, try to co...

Top