Average (Daily) Range

Average (Daily) Range

Hello all,

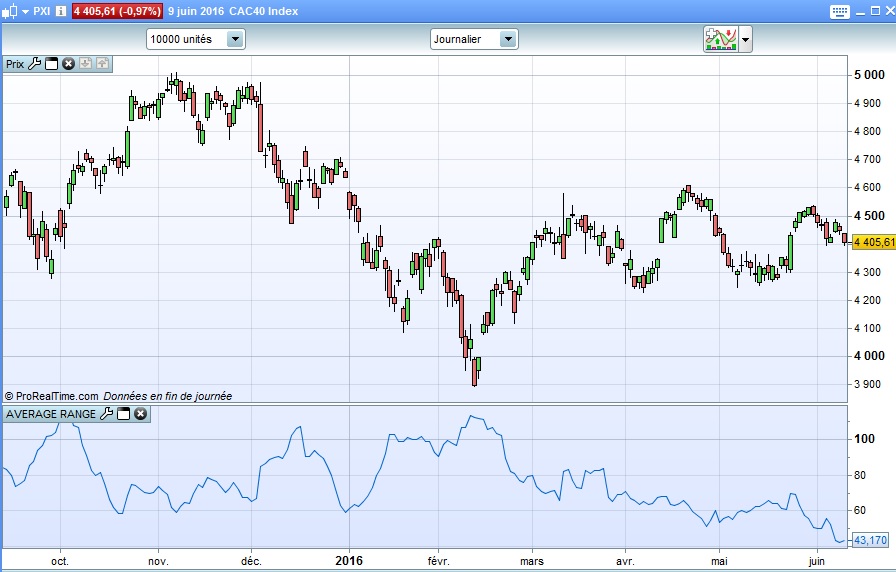
I was very surprised that I couln’t find the “Average Daily Range” indicator, although it is a very simple and important one.

This simplified code can draw the ADR, but can also be applied to any timeframe.
So it would be the average range of the “p” last bars.

Beware, it is not the Average True Range.

Share this

Risk disclosure:

No information on this site is investment advice or a solicitation to buy or sell any financial instrument. Past performance is not indicative of future results. Trading may expose you to risk of loss greater than your deposits and is only suitable for experienced investors who have sufficient financial means to bear such risk.

ProRealTime ITF files and other attachments : How to import ITF files into ProRealTime platform?

PRC is also on YouTube, subscribe to our channel for exclusive content and tutorials

  1. David • 06/10/2016 #

    Hi Doc. Thanks for sharing. To me there’s isn’t much difference between this and the ATR and your code is not set for “daily” unless you use the daily chart?
    I’m looking at developing the Average Daily Range to use on lower time-frames like I did here for the Moving Average Daily here: http://www.prorealcode.com/topic/daily-moving-average-with-customclose-on-non-daily-timeframe/#post-18761 
    I might try to make it during the holidays but thought you might be interested in making it the meantime if you have free time. 

    • Nicolas • 06/10/2016 #

      Hi David, this code is not the proper daily ATR, which is calculated as follow according to the probuilder documentation: 
      True range is the highest data in absolute value among :
      (today’s high – today’s low)
      (today’s high – yesterday’s close)
      (today’s low – yesterday’s close)
      To calculate the Average True Range, it is necessary to apply a Wilder moving average of the True Range.
      The code should be:
      period = 14

      //True range calculation
      d1 = Dhigh(0)-Dlow(0)
      d2 = abs(Dhigh(0)-Dclose(1))
      d3 = abs(Dlow(0)-Dclose(1))

      dailyTR =max(d1,max(d2,d3))

      c = wilderaverage[period](dailyTR)

      RETURN c as \"Daily Timeframe ATR\"
      But there is still a problem to calculate the Wilder Average of daily values array into a lower timeframe.. Understand, that this code don’t give you the good value because in this case the WilderAverage of 14 periods use the last 14 candlesticks of the timeframe on which the indicator is attached, not the last 14 daily values.

  2. David • 06/10/2016 #

    Thanks for the explanation Nicolas.

  3. freecat1899 • 06/10/2016 #

    Hello, I wanted to create a percent ADR based on this indicator, so I wrote this code that IMO it looks ok:

    // AVERAGE DAILY RANGE PERCENTAGE

    PMAXAVG = average[p](high)
    PMINAVG = average[p](low)
    PAVG = average [p] (close)
    ADRP = (PMAXAVG – PMINAVG)/PAVG*100

    return ADRP as “Average Daily Range Percent”

    However, when I use it, it doesn’t seem to give out correct values as it is giving me a higher value than the ATRP described in this post for the same 20 daily periods:

    https://www.prorealcode.com/prorealtime-indicators/average-true-range-percent-atrp/#:~:text=The%20Average%20True%20Range%20Percent,variation%20and%20not%20prices%20itselves.

    From my understanding of ADRP and ATRP, ADRP should always be lower than ATRP as it doesn’t include gaps.

    Can someone help me out? thanks

  4. revstrat • 06/10/2016 #

    At first glance, I see this mistake. You shouldn’t average the highs and the lows. You should be averaging the ranges.

avatar
Register or

Likes

avatar avatar avatar avatar
Related users ' posts
oliverkeim Hi, also here not working. Only white lines.
killerplatuze Dont work anymore with the current version?
KryptoKat tolle Arbeit, professionell
Nicolas Ask on an Excel website?!
JJMR HOLA NICOLAS, TENGO LA ULTIMA VERSION ACTUALIZADA DEL INDICADOR TTM SQUEEZE PRO EN LA VERSIO...
imokdesign @nicolas ,if in want to "call" this indicator, which values i have to write down?
Screw27 Salut nicolas j'aimerais savoir tes résulats grace a cettte methode
eva.g.forsgren It dose not work, I get a strap instead of candels???????????????????????????????????????????
Nicolas That indicator is the one below the chart. The indicator to put on the price chart is this o...
pyhrus P.S : IG , que j'ai contacté ,m'indique que la version V11 , ne sera pas disponible avant un...
Hasardeur Dear Nicolas, is there someting at the arry to modify in order to run the trend at the actu...
MALIMALO Dear Nicolas, just try touse your indicator with backtest but it's not working. is anybody...
supertiti Bonjour Nicolas, Je ne comprend pas bien , le trend change de couleur quand les prix sont a...
Nicolas Oui ce serait possible, cependant l'indicateur est bien prévu pour conserver la couleur de l...
supertiti Quand tu pourras si tu peux nous coder la troisième couleur cela améliorerait les trades cou...
Nicolas remplacer les valeurs de coloured(0,255,0) par coloured(r,g,b) et ajouter ces noms de variab...
mohamed merci Nicolas!
sacram14 Merci Nicolas pour ce set-up que je ne connaissais pas ! J'ai tenté de reprendre le code pou...
LucioleLucide Clean view, thanks for sharing
dertopen hi where i can found the window for candle configuration?
paolosab69 Ciao! . I have seen the pictures that explain this metod but i don't understand when is mome...
Nicolas It may be possible that the variables are still present in the code while they are also in t...
luxrun I found this solution, thanks
luxrun thanks Nicolas
Brisvegas Thats Awesome thank you
Vinks_o_7 Thanks Vonasi !
swapping fib1236 = (hiday-lowday)*1.236+lowday DrawSegment(startbar,fib1236,barindex,fib1236) colou...
swapping Oups ! Nicolas il y a un problème avec l'insertion de code en utilisant le bouton [Add PRT ...
swapping fib1236 = (hiday-lowday)*1.236+lowday DrawSegment(startbar,fib1236,barindex,fib1236) colour...
ALE Very Very Nice
manel Hi - Many thanks for this and your other analytical codes, stellar work - very useful ! With...
Vonasi Good idea Manel. I have posted a new version here that shows results as a percentage: https:...
mathiasKN Steffen Schmauch • 12/11/2018 # hello Nicolas, can I change the indicator that I only get t...
Nicolas Please open a new topic in the indicator forum and explain there your query, thank you.
upupandaway This seems like a very useful indicator. However, it does not seem to open properly in the c...
DanT01 Hi Nicolas, great work! Is it possible to contact you to help with a couple of indicators? T...
Nicolas Assistance is free on forums. For private job, you can contact me with the trading programmi...
avatar
Anonymous Thank you! I was reading the book Beyond Technical Analysis and wanted to try to coding RAV...
Juan Salas Hi FULVIO09, Nice piece of work. It seems to work very well. Does only work for INDEXES??...
Johann Hi @FULVI09, I understand the instructions however I'm not too sure how to determine the "p...
Player8520 Hello, It doesn't work with me either. However, I changed AA to 180 on line 15, added th...
Nicolas Apply it on the price chart. The indicator plot just one single line. There are two in the...
jamesoc Hi Nicolas, do you happen to know if there is an indicator that can be applied to charts, to...
gustavobp Buenos dias Nicolas, al agregar tu indicador no me reconoce la variable Price ni en la linea...
GertLjung Ok, thanks
marinober Gentile Nicolas, l'indicatore mi da errore : ciclo infinito o con troppe iterazioni, modific...
Nicolas Se la stai usando in un piccolo lasso di tempo, assicurati di avere unità sufficienti visual...

Top