ADR no sunday bar

v10.3
ADR no sunday bar

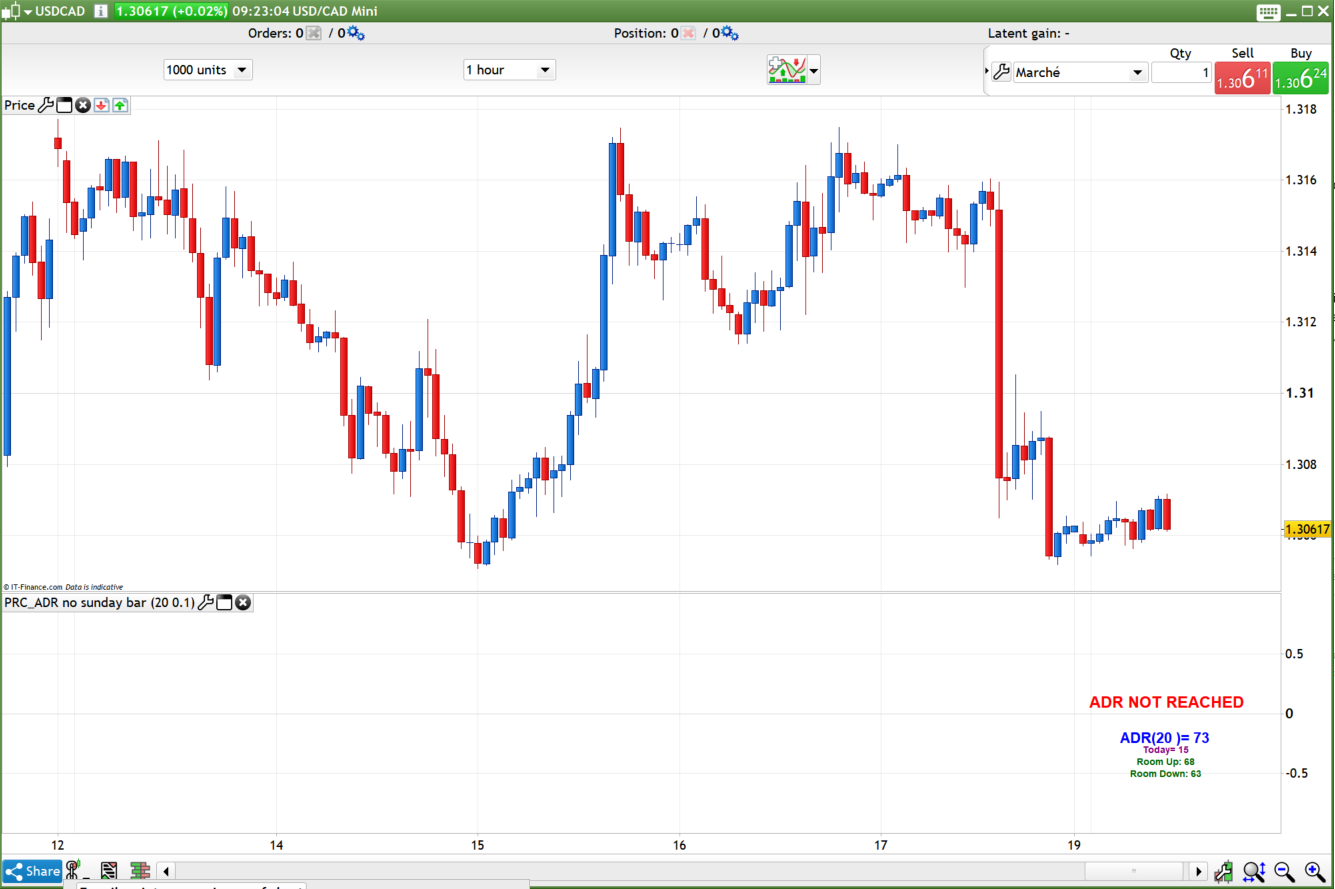
This indicator displays ADR information in the lower left side of the chart screen. It calculates the Average Daily Range with exclusion of the Sunday bar to be more accurate with the real daily range of the market.

5 text lines are displayed, from top to bottom:

  • Information about the current daily range and if it has reached or not the ADR value. If the today range is superior to the ADR, the market could have not more “space” to move further
  • the ADR value (period is in parenthesis, you can change the period in the indicator’ setting)
  • the today range in points
  • Room up: how many points up still available to reach the ADR
  • Room down: how many points down still available to reach the ADR


Share this

Risk disclosure:

No information on this site is investment advice or a solicitation to buy or sell any financial instrument. Past performance is not indicative of future results. Trading may expose you to risk of loss greater than your deposits and is only suitable for experienced investors who have sufficient financial means to bear such risk.

ProRealTime ITF files and other attachments : How to import ITF files into ProRealTime platform?

PRC is also on YouTube, subscribe to our channel for exclusive content and tutorials

  1. Domenec • 08/20/2018 #

    Hola Nicolas es posible? que en la linea 58 haya un error de codigo creo que la instruccion exacta deberia de ser if(rmup0) then o sea rmdn > que 0 sino no valida el adr alcanzado cuando si que lo alcanza No lo se ya sabes que en programacion de PRT no voy muy fuerte solo estoy empezando Como siempre un grandisimo trabajo el tuyo y este indicador/oscilador lo veo muy util para disponer de la informacion adicional aunque luego el mercado siempre tiene la ultima palabra

    • Nicolas • 08/20/2018 #

      En la línea 58, pruebo si el rango del día ha probado tanto el valor disponible en la parte superior como la inferior para validar si se ha alcanzado o no la ADR. Podríamos reemplazar con “if (rmup <0 o rmdn <0) then"

  2. Domenec • 08/20/2018 #

    Si ayer por la noche ya vi que posiblemente era mejor la or que el and ya que lo que se busca es que alcanze al menos uno de los dos sin embargo hoy siguiendolo en dax me he dado cuenta del problema que detectaba ayer el precio llega hasta uno de los dos arriba o abajo y el mensaje es adr alcanzado sin embargo si despues gira y no sigue manteniendo el cuerpo de la vela por encima o debajo del room el mensaje vuelve a ponerse rojo y es de adr no alcanzado y entiendo que esto lleva a confusion sobre todo si lo utilias como analisis rapido de varios instrumentos por ejemplo ahora en dax es adr 20 periodos = 131 Today =142 roomup en rojo=3 y el mensaje esta en rojo de adr no alcanzado cuando si que lo ha alcanzado de sobras A ver como todos los indicadores tiene la importancia que tiene ya que no es mas que una media de las n velas diarias que busquemos sin embargo es solo una media si analizamos las velas de este periodo encontraremos muchas velas que solo llegan a 0,5 adr y otros dias que si que recorren hasta 3 adr en un dia pero si lo utilizamos como una herramienta mas de analisis y el mensaje de adr alcanzado en verde quedara fijo una vez alcanzado si que podria ser muy util si vemos que lo ha alcanzado y ha rebotado estableciendo una situacion de rango que para los intradias podria ser muy interesante muchisimas gracias por todo

  3. Domenec • 08/20/2018 #

    Ya esta he cambiado el codigo de la linea 58 por “if t > adr then ” asi en el momento que rmup o rmdn lleguen a 0 seguro que se cumple que el recorrido es superior al de la media por tanto today sera superior a adr(n) y quedara fijo el mensaje de adr alcanzado en verde si en esta zona rebota puede ser una muy buena informacion para los inversores siempre mirando el grafico de forma mas general obviamente pero es que segun estudios de terceros es normal que se suelan crear rangos temporales con una distancia aproximada de 3 adr y esto puede ser muy bueno para operar ya que un rango de 400 puntos es muy operable y con altas posibilidades de exito muchisimas gracias

  4. GertLjung • 08/20/2018 #

    Hi Nicola. I like the ADR a lot. One problem though. When I try to shrink the square all the text goes on top of each other and you can`t read it. Is it easie to fix?

    • Nicolas • 08/20/2018 #

      No sorry because the X,Y coordinates are in price and bars, not in pixels.

  5. Nicolas • 08/20/2018 #

    The indicator has been updated to be perfectly the same as the original version., as discussed in this topic: https://www.prorealcode.com/topic/average-daily-range/

  6. GertLjung • 08/20/2018 #

    Ok, thanks

  7. marinober • 08/20/2018 #

    Gentile Nicolas, l’indicatore mi da errore : ciclo infinito o con troppe iterazioni, modificare il ciclo corrispondente, non sono 1 programmatore , come lo posso sistemare ? grazie

    • Nicolas • 08/20/2018 #

      Se la stai usando in un piccolo lasso di tempo, assicurati di avere unità sufficienti visualizzate per l’ADR di X giorni da calcolare correttamente.

avatar
Register or

Likes

avatar avatar avatar avatar avatar
Related users ' posts
Nicolas It may be possible that the variables are still present in the code while they are also in t...
luxrun I found this solution, thanks
luxrun thanks Nicolas
swapping fib1236 = (hiday-lowday)*1.236+lowday DrawSegment(startbar,fib1236,barindex,fib1236) colou...
swapping Oups ! Nicolas il y a un problème avec l'insertion de code en utilisant le bouton [Add PRT ...
swapping fib1236 = (hiday-lowday)*1.236+lowday DrawSegment(startbar,fib1236,barindex,fib1236) colour...
mathiasKN Steffen Schmauch • 12/11/2018 # hello Nicolas, can I change the indicator that I only get t...
Nicolas Please open a new topic in the indicator forum and explain there your query, thank you.
upupandaway This seems like a very useful indicator. However, it does not seem to open properly in the c...
zilliq Be careful, It works only if you are in daily timeframe, and on your graphic you are on hou...
DerPat I guess you are right, like always. If you change n to 24 you have at least the hours of a d...
gabri DerPat, you can also change line1 to read as follow to adapt this script to hourly timefram...
David Thanks for the explanation Nicolas.
freecat1899 Hello, I wanted to create a percent ADR based on this indicator, so I wrote this code that I...
revstrat At first glance, I see this mistake. You shouldn't average the highs and the lows. You shoul...

Top