Three lower (and higher) Closes John Carter’s Scalping Indicator

v10.3
Three lower (and higher) Closes John Carter’s Scalping Indicator

Hi to all,

I’m reading chapter 14 of John Carter’s “Mastering The Trade” (2nd edition), which describes a setup to open position after trend has changed and a three candle pattern has been formed.

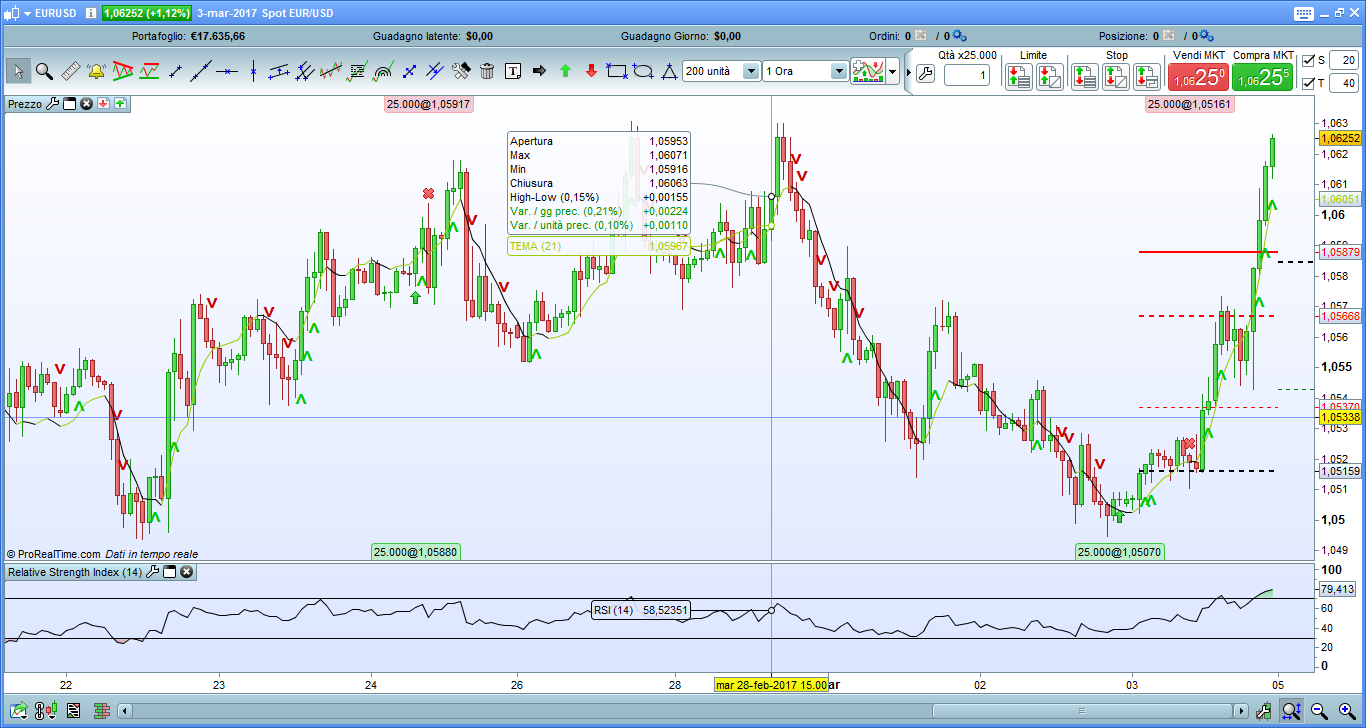
For example, to go short following new trend when old trend was bullish, Carter says that you have to check for three consecutive lower closes, that means that reversal has been confirmed and trader has to go short at market.

At the same way, reversed rules are valid for bullish signal: after a reversal from a bearish to bullish, you have to check for three consecutive higher closes.

Carter adds a filter to avoid “Flags” (consolidation situations): in case of three lower closes, the close of the last two candles must be lower than the low of the first candle of the pattern; at the same way for bullish, the close of the last two candles must be higher than the high of the first candle of the pattern.

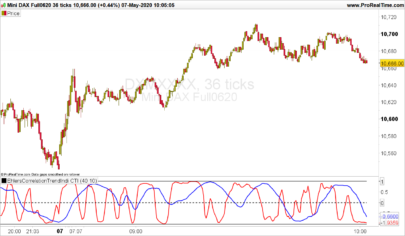
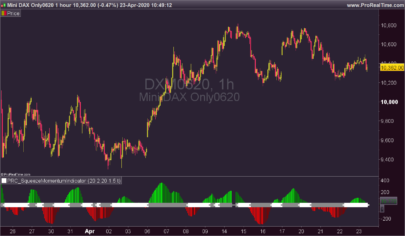
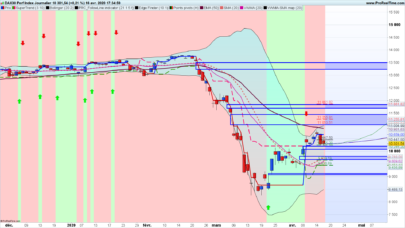
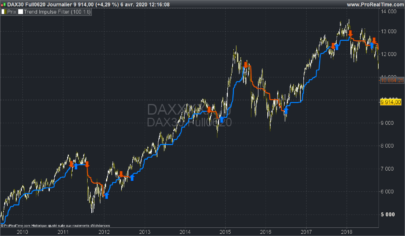
Using that rules, I tried to write an indicator that paint green (for bullish) an red (for bearish) arrows on the chart.

Note that when the first arrow is painted after a market reversal, You are on the market so You must ignore the following candles having the same color.

The original John Carter’s indicator for Trade Station put the signal to the first candle of the pattern. My indicator put the arrow to the third candle of the pattern, that is the entry candle.

Here’s the code:


Share this

Risk disclosure:

No information on this site is investment advice or a solicitation to buy or sell any financial instrument. Past performance is not indicative of future results. Trading may expose you to risk of loss greater than your deposits and is only suitable for experienced investors who have sufficient financial means to bear such risk.

ProRealTime ITF files and other attachments : How to import ITF files into ProRealTime platform?

PRC is also on YouTube, subscribe to our channel for exclusive content and tutorials

  1. zilliq • 03/06/2017 #

    Hi Francesco,
    Thanks for your code,
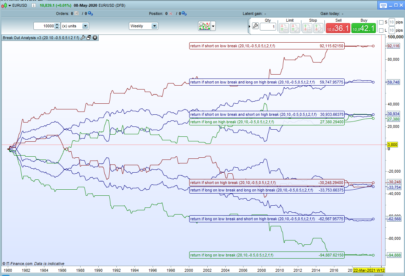
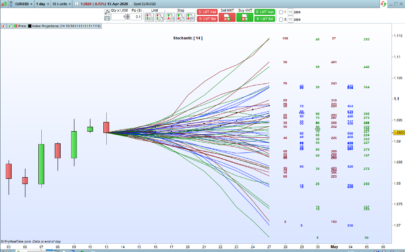
    There is a little error. You need to add the notion of reversal (-1/+1). Because without this you will have too much signal as you see on your picture
    Carter advice to take position to the third and exit wit hthe other signal
    Sadly, I do an algo last week and the results are not very fantastic…May be the things change since his book
    Regards
    Zilliq
     
    https://www.zilliqtradingresearch.fr/
    Coding is not a crime 😉
     

    • mikael • 03/06/2017 #

      Hi Zilliq!
      I don`t understand were to put the notion of  reversal (-1/+1). Can you please exlain or show in the code?
       
      Regards Mikael

  2. Sofitech • 03/06/2017 #

    Hello. How can we modify the code to have an alert on each arrow buy and sell…? RETURN…..So we can test it with an alert in Prorealtime ?

avatar
Register or

Likes

avatar avatar avatar avatar avatar avatar
Related users ' posts
JohnScher I've been looking for this for a long time! A very big thank you to you.
Nupsator hi, looks very interesting, i imported the indicator and inserted it into a 1h chart. Unfort...
Ciccarelli Franco Lo trovo interessante, ma non riesco a scaricarlo. Chi mi può aiutare?
Bard Excellent job Vonasi, thanks very much for updating and improving your previous indicator.
Gianluca sorry but doesnt work like you posted
Vonasi You would need to let me know the exact instrument and time frame that you are trying to app...
ipbvba idem ne fonctionne pas sur V11 (meme avec real time data), import OK mais aucune courbe dans...
Ciccarelli Franco I'm new to the Market, I imported the code, but I don't see anything, there is an empty box ...
tradermikey Is the available for v12?
Nicolas remplacer les valeurs de coloured(0,255,0) par coloured(r,g,b) et ajouter ces noms de variab...
mohamed merci Nicolas!
sacram14 Merci Nicolas pour ce set-up que je ne connaissais pas ! J'ai tenté de reprendre le code pou...
Vinks_o_7 Thanks Doc !
Maxime Baudin Intresting, thank you!
Nicolas Pour créer des alertes, vous pouvez suivre ce petit tutoriel : https://www.prorealtime.com/f...
thibault76 Bonjour Nicolas, cette stratégie est intéressante. Par contre, en 2022, le code ne fonction...
Nicolas Aucun message d'erreur pour ma part en version 11.1. Tu es certain de créer un code d'indica...
1Randy I would be interested an invite to your blog. I am still learning about the VSA and it looks...
repropel Buenos días TACBOLSA. Yo también estoy interesado en visitar tu blog. Podrías enviarme una i...
mobychix Hi, I just joined Pro Realtime and am very interested in VSA. I have read some books and did...
Stockastiss Can this code be simply transferred into Backtestingcode so one doesnt need to use call ? (i...
Vonasi Sorry for the late reply. Add the code to your strategy and remove line 5 and line 39. Chang...
viktorthunss Hi! How many averages are there? Can I see the somewhere?
carpentier Joffrey Bonjour à tous, Avant tout merci pour ce travail, cependant je suis bloqué quand je l'insta...
carpentier Joffrey Re, C'est ok, j'ai trouvé mon erreur... Cependant sur quel base peut on calculer son CALC...
Aragorna Hi Nicolas, How is it possible to use it in a higher timeframe plotted on a lower timeframe?...
Zigo Normaly it do work in version 11.
bertrandpinoy Hello to all, please does a coder can bring the indication of the price level on the chart o...
Zigo @bertrandpinoy add between line 50 and 51 : drawtext("#dnh#",barindex,low-2.618*AverageTrue...
leofi https://www.prorealcode.com/topic/simple-average-with-visual-color/
leofi Go visit www.prorealcode.com/topic/simple-average-with-visual-color/ and watch 2em post
Dritan Hi,I am new on Prorealtime and coding.I downloaded the indi but I have it on a separate wind...
stephane2.0
5 years ago
stephane2.0 c=exponentialaverage[9](MACDLine[12,26,9](close))
Forexcheckup Hi I down loaded the ITF file, it paints red for a down trend but for all up trends the can...
stephane2.0 line 22: r = 195 by r = 0 line 23: g = 195 by g = 0 line 24: b = 195 by b = 255 ;)
Zigo
6 years ago
fifi743 Good morning, there is no mistake about the shorts c11=SMI[14,3,5](close)>-40
Zigo has to be c11=SMI[14,3,5] < -40 (indeed)
xar3 Thank you ;-) Zigo
Suzu Yuk Regarding line68, //-- with indicator "properties", add coloured fill between euroOFF and...
manual_ice As far as I know, it is not possible to include "fill" inside an indicator. But, since ve...
Morrissey38 Muchísimas gracias Nicolás , muy amable.
Bruno Carnazzi extrèmement pertinent
Bruno Carnazzi Is that beatable ?
Maxime Baudin Very useful! Thanks Mat, and Happy New Year
nicko Great work. Thank you. However I am having trouble getting it to print in the first bar. If ...
Nicolas
6 years ago
Rex Oscillator
Rex Oscillator
2
Indicators
Rollerbob thank you Nicolas !
Guibourse Thanks ! Would it be possible to translate it into a screener ?
Nicolas
6 years ago
KDJ
KDJ
3
Indicators
fireleg79 Bonsoir Nicolas. Merci pour tout ton travail. Quand tu auras le temps pourras-tu jeter un oe...
Sejibi Bonsoir, En remplaçant percentJ = 3 * percentD - 2 * percentK par percentJ = 3 * perc...
JMARTY Bonjour, A la recherche d'un indicateur détectant les divergences sur DMI, je tombe sur ce...
Alps007 Hi Nicolas. Happy New Year. Can you please program me several MACD divergence screeners ...
Arlei Zanin Hello Nicolas, would it be possible to convert the Cloud to Pascal language? Thank you.
ashee i want it in MT4
robertogozzi Like my screener https://www.prorealcode.com/prorealtime-market-screeners/abcd-pattern-scree...
aldtrading Thanks for your work. I'm using V11 and nothing is drawn on the chart, I believe this is ...
robertogozzi It works on v10.3, v11 and v12. You are likely to have added it BELOW your chart (like RSI),...

Top