MyThermometer as optical signal transmitter

MyThermometer as optical signal transmitter

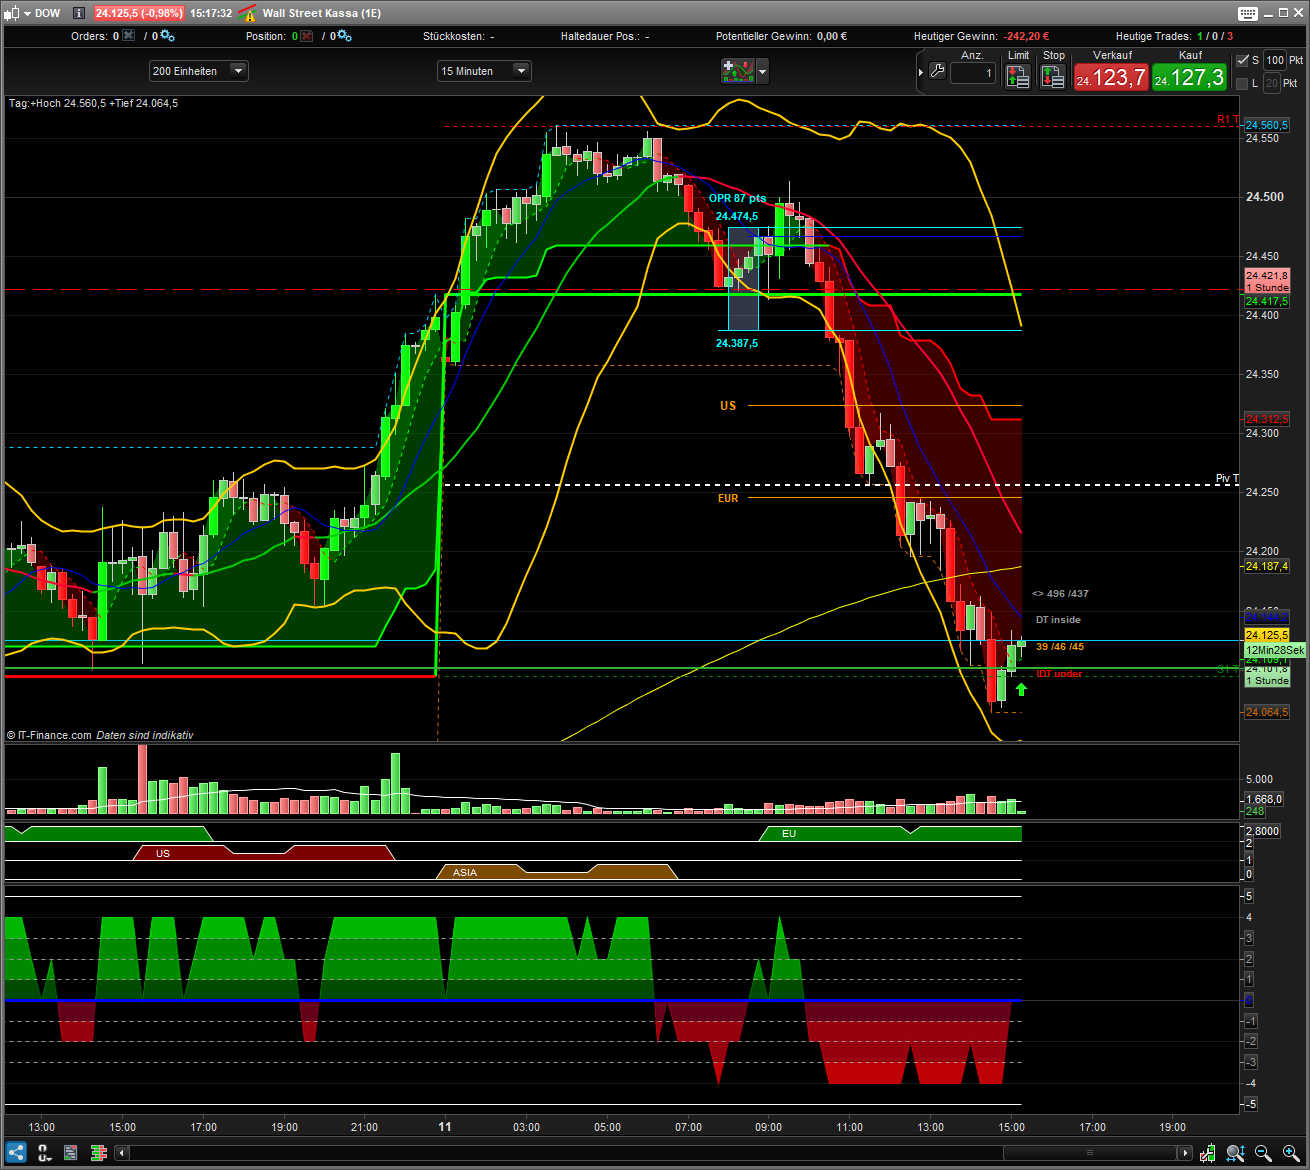
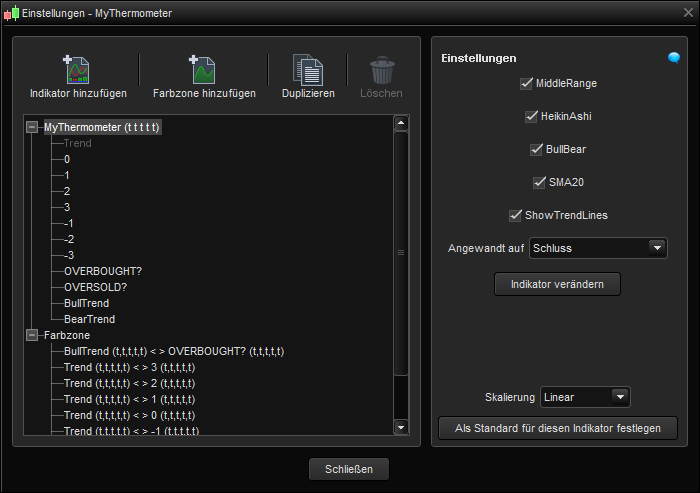
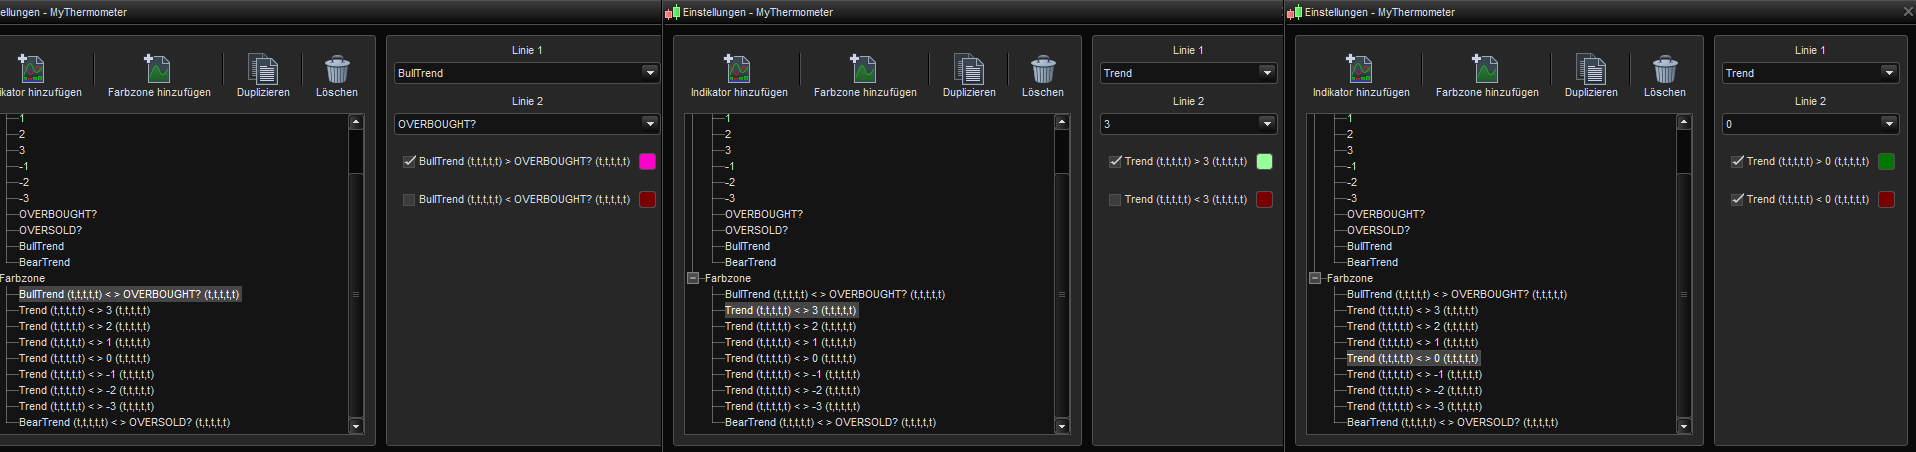
You can choose one to five indicators for analysis. In your PRT, you only have to add color zones to get the display shown. You can also remove all lines in the code (at Return) if you prefer to work with a sine curve.
It helps me to stick to my rules. I hope it helps you too and brings money 😉
The revised indicators “myCandle …” and “Opening Range …” and “OutsidebarColorSolo” are coming soon (click on my profile and follow me to stay updated).


Share this

Risk disclosure:

No information on this site is investment advice or a solicitation to buy or sell any financial instrument. Past performance is not indicative of future results. Trading may expose you to risk of loss greater than your deposits and is only suitable for experienced investors who have sufficient financial means to bear such risk.

ProRealTime ITF files and other attachments : How to import ITF files into ProRealTime platform?

PRC is also on YouTube, subscribe to our channel for exclusive content and tutorials

  1. ludo7769 • 05/12/2020 #

    malheureusement ne fonctionne pas sur V11

    • Thomas • 05/12/2020 #

      Désolé, je n’ai pas encore de version 11.
      EDIT: Works with V11,
      https://1drv.ms/u/s!AlLFPjbX_wf1oKEzLbHvxEwIN60BUw?e=6AIYhf

  2. Thomas • 05/12/2020 #

    Wenn sich Bull- und Beartrend zwischen 2 und -2 bewegt, deutet dies meist auf eine Konsolidierung / Seitwärtsphase hin. Wer mag kann sich diesen Bereich zusätzlich einfärben, wie in diesem Beispiel.
    If the bull and bear trend is between 2 and -2, this usually indicates a consolidation / sideways phase. If you like, you can also color this area, as in this example.
    https://1drv.ms/u/s!AlLFPjbX_wf1oKEviciNHbCR2uxxoQ?e=xLQzy4

    https://1drv.ms/u/s!AlLFPjbX_wf1oKEw-1NoUXOvaelCzw?e=3715ph

    • BullBear • 05/12/2020 #

      Insgesamt sehr interessant. Vielen Dank für die weitergehenden Erläuterungen.

  3. Thomas • 05/12/2020 #

    Ich habe den Bereich “Bull-/BearTrend” verändert. So liefert er sauberere und stabilere Signale. Hier der Code:
    I have changed the “Bull / Bear Trend” area. So it delivers cleaner and more stable signals. Here is the code:

    if BullBear = 0 then
    C = 0
    elsif BullTrend > 1 and BearTrend >= -2then
    C = 1
    elsif BearTrend < -1 and BullTrend <= 2 then
    C = -1
    endif

  4. ESCapedTestSubject • 05/12/2020 #

    Interesting. Many thanks.
    What is the market open indicator that you use? Could you share that one please?
    Thanks!

  5. Lean • 05/12/2020 #

    Hi! I love your indicator, but from some days ago it doesn’t work in pro real time, do you know what could have happened? Thank you!

  6. oliverkeim • 05/12/2020 #

    Hi, also here not working. Only white lines.

  7. killerplatuze • 05/12/2020 #

    Dont work anymore with the current version?

  8. KryptoKat • 05/12/2020 #

    tolle Arbeit, professionell

avatar
Register or

Likes

avatar avatar avatar avatar avatar avatar avatar avatar avatar avatar avatar avatar avatar avatar avatar avatar

+3 more likes

Related users ' posts
gidien
2 months ago
Cram13 Bonjour, qu'elles sont les valeurs des variables ? Avec mes remerciements Marc
gidien This indicator will not return any value. You can change the last line to : return ao...
gidien SMA1 = MovingAverage Length applied to the source candles (high , low, op...
Bateson
4 months ago
finplus Bonjour, une petite demande concernant cet indicateur : comment faire pour que lorsque la bo...
LucasBest Bonjour, la coloration des bandes se fait ligne 111 et 112 à l'aide des instructions colorbe...
Nicolas Simple strategy with this indicator is available here: https://www.prorealcode.com/topic/ut-...
FXtonio Nicolas.... MERCI 1 millions de fois, cet indicateur gagne dans 75% des cas en scalping m1 ...
davy42 bonjour, à quel moment apparait le fleche, à l'ouverture ou la fermeture de la bougie? merci
BriceE Bonjour Nicolas, Je suis a la recherche d'indicateurs pour me donner la meilleure indicatio...
YvesRobert Bonjour Nicolas, concernant cet indicateur j'ai voulu l'utiliser mais il commence à tracer l...
Nicolas Je ne rencontre pas ce problème avec le NASDAQ par exemple, ce serait plus simple d'ouvrir u...
YvesRobert Bonjour Nicolas, en effet ca marche, je me suis trompé, j'ai bien tout le tracé. C'est parce...
Jiacky
2 years ago
Range Factor
Range Factor
0
Indicators
Sever
2 years ago
Stenozar Hi Sever, how can I visualize the coloured areas?
Sever Hi Stenozar, You need to add the color zones yourself , just go to Add Color Zone To set ...
Boris Hi IVMcm, thanks for your amazing work. I have tested all of your indicators and use some of...
IV Mcm With pleasure and thanks!
ashiash how to use this indicator can i use tradingview platform
IV Mcm Good job !
Seabiscuit Hi! I like this indicator a lot, been using it on a 30 min timeframe and usually confirms my...
Ramahu Bonjour et merci pour cet indicateur ! je l'observe sur les actions du Nasdaq et la plupart ...
IV Mcm Line 68 and 70, you must delete the instruction at the end of the line "" Bordercolor(0,0,0,...
BoutDePain This instruction is for the V11 maybe that you are using V10.3 then you can safely remove it.
Protagonist Bonjour, Je vois l'instruction inRange mais je ne trouve pas sa signification. Pouvez-vous...
Nicolas
3 years ago
Nicolas La définition des couleurs se situent entre les lignes 94 et 118. Selon le type de bougie (h...
Manu35250 Bonjour Nicolas, Est il possible de convertir cet indicateur en screener ? J'essaie depui...
Nicolas Bien sûr, merci de formuler la demande dans le forum approprié en respectant les règles de p...
PHAN100 bonjour, bravo à l'auteur pour cet indicateur visuel sur le graphique, il nous reste à va...
IV Mcm Vous devez faire un clic droit sur le prix > propriété > ajouter indicateur Si vous...
punch1 Fonctionne pas chez moi il s'affiche rien pourtant j'ai bien fait le clic droit sur le prix ...
punch1 Je peux te faire un screen d'ecran si tu as un email :)
Fabian Hi Thomas, thanks for your explanations. Which indicator do you use in the screenshot ...
Thomas Thats On Balance Volume and Bollinger or SMA or what you want. It shows me the volume flow. ...
bertrandpinoy @MAKSIDE I would be grateful if you send me your version. have a nice day

Top