
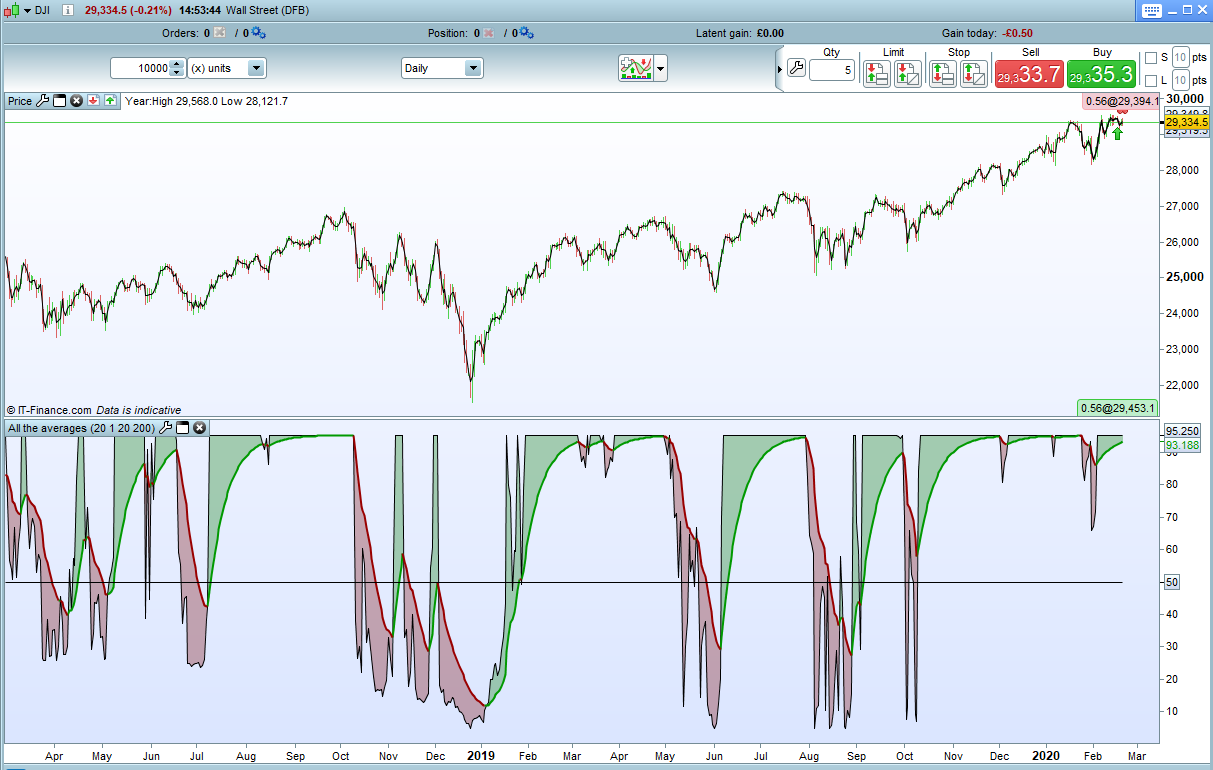
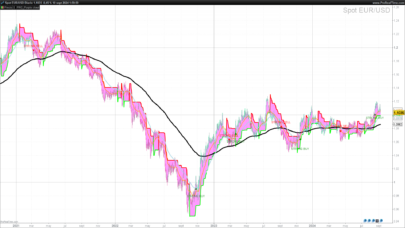
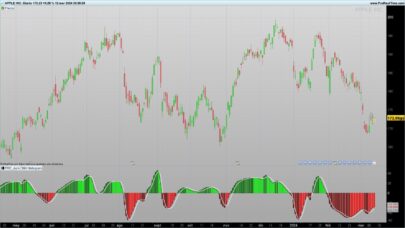
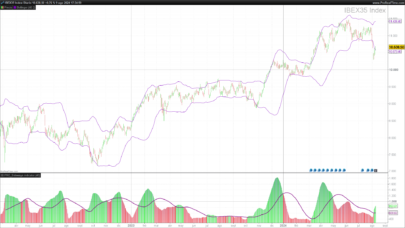
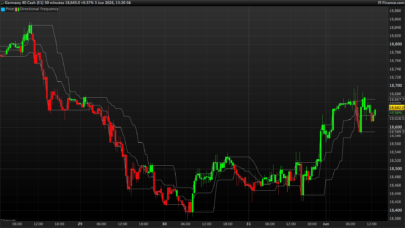
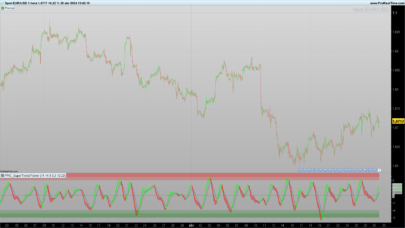
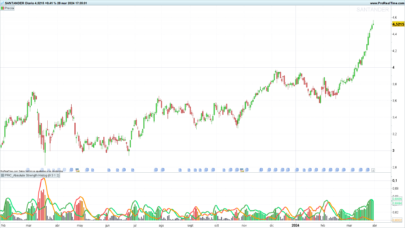
This simple indicator compares price to a large range of averages and counts how many averages the price is above or below and how many of the averages are rising or falling. It then displays the result as a value between zero and 100. An average line of period ‘p’ is also applied to the result.
Below 50 indicates strong downward strength in all the averages and above 50 strong upward strength. A crossing over of the average line can indicate a change of direction in the trend.
The indicator can be used for identifying trend direction and strength of trend or for spotting turning points in the market.
‘Startp’ is the lowest average period to be checked and ‘Endp’ the highest. All averages between these and including them are used in the calculation.
‘t’ is the average type (0 = SMA, 1 = EMA etc)
As always I advise downloading the ITF file and importing it to get full functionality.
|
1 2 3 4 5 6 7 8 9 10 11 12 13 14 15 16 17 18 19 20 21 22 23 24 25 26 27 28 29 30 31 32 33 34 35 36 37 38 39 |
//All The Averages Indicator //By Vonasi //20022020 defparam calculateonlastbars = 1000 p = 20 //average period t = 1 //average type startp = 20 //start of averages test range endp = 200 //end of averages test range total = 0 total2 = 0 for a = startp to endp if average[a,t](customclose) > average[a,t](customclose[1]) then total = total + 1 else total = total - 1 endif if customclose > average[a,t](customclose) then total2 = total2 + 1 else total2 = total2 - 1 endif next mytotal = (total+total2)/2 avg = average[p,t](mytotal) maxp = endp*2 mytotal = mytotal + endp avg = average[p,t](mytotal) mytotalperc = (mytotal/maxp)*100 avg = average[p,t](mytotalperc) return mytotalperc as "result",avg as "average",50 as "mid line" |
Share this
No information on this site is investment advice or a solicitation to buy or sell any financial instrument. Past performance is not indicative of future results. Trading may expose you to risk of loss greater than your deposits and is only suitable for experienced investors who have sufficient financial means to bear such risk.
ProRealTime ITF files and other attachments :
Find other exclusive trading pro-tools on ![]()
PRC is also on YouTube, subscribe to our channel for exclusive content and tutorials


Can this code be simply transferred into Backtestingcode so one doesnt need to use call ? (i can´t get Call to work and i would prefer if the whole trading-code was in the Code section)
I would like to use the “avg Crosses over 50” or “Result crosses over avg”
is that an easy fix ?
Sorry for the late reply. Add the code to your strategy and remove line 5 and line 39. Change all the ‘customclose’ to ‘close’ or whatever type of price you want to use in the calculations and then use ‘avg crosses over 50’ and ‘mytotalperc crosses over avg’ in your strategy conditions.
Hi! How many averages are there? Can I see the somewhere?