When the price breaks a resistance or a support level, there is a breakout.
But most of the time when the price meets a level of support or resistance it is rejected back. If not, it would not make sense to talk about supports and resistances.
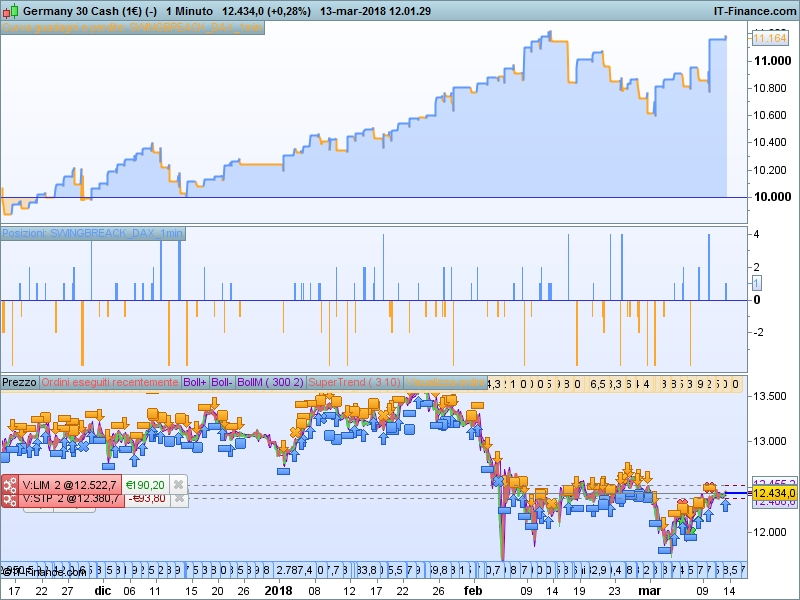
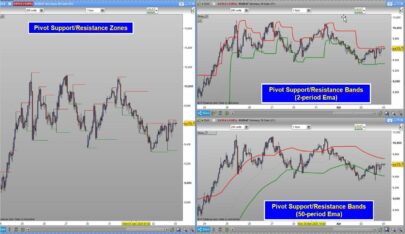
This strategy searches for levels of support and resistance. The levels are dynamic in the sense that they are periodically updated every 2 hours.
We are looking for inversion patterns on these levels where, we hope, the price rebounds.
The patterns used here are the “pin bar” and the “engulfing”.
- The “pin bar buy” is a green candle with a small body and a long lower sword.
- The “pin bar sell” is a red candle with a small body and a long upper sword.
- The “bullish engulfing” consists of 2 candles, the first red and the second green that totally incorporates the first one.
- The “bearish engulfing” is composed of 2 candles, the first green and the second red that totally incorporates the first one.
(Note that the “engulfing” is a masked “pin bar” – example: an “engulfing” on timeframe at 1 min becomes a “pin bar” on timeframe at 2 min.).
Of course you can also use other inversion patterns, for example, morning stars, evening stars, hammers, doji, harami, narrow ranges, etc. At you find the best ones. Or, why not, an indicator of overbought and oversold (RSI, Stochastic, etc).
At the contrary, in the event that there was a “breakout”: that is if the price broke through the support or resistance, we buy or sell on a retracement in the direction of the trend.
The strategy is implemented with the possibility of increasing the number of contracts to buy / sell (see warnings in the code).
In addition, a daily monetary stoploss and a daily monetary profit target are set. If exceeded, no other operations are performed that day.
The orders are all “stop orders” and remain valid for the 3 bars after the entry signal has occurred.
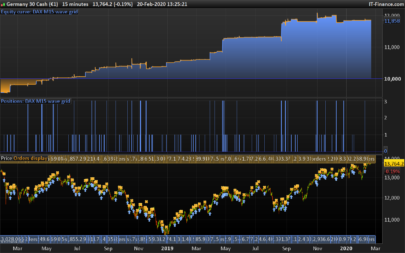
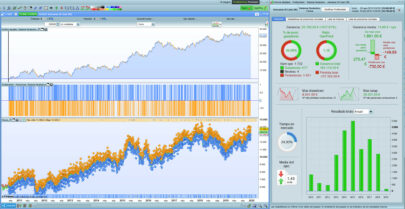
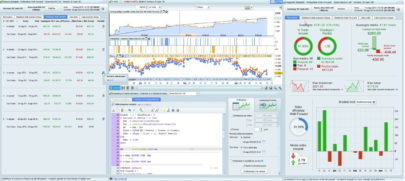
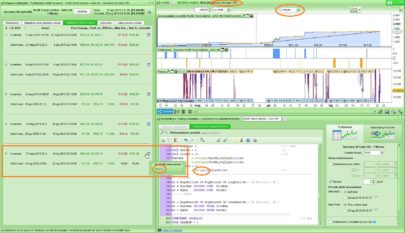
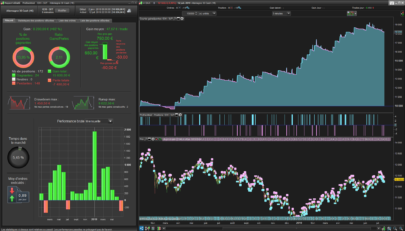
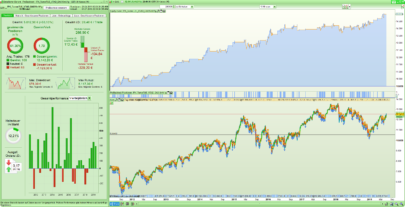
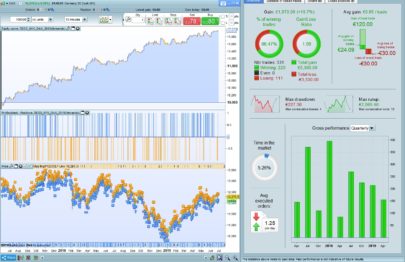
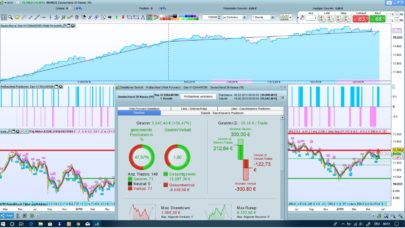
The strategy has been tested on
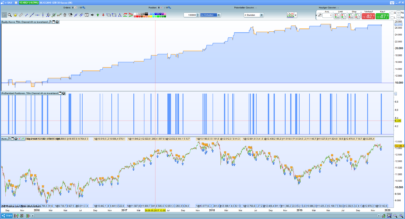
Market: DAX – Timeframe 1 Min. – Capital € 10,000 – spread 1 point.
Many thanks to all those who want to test and / or implement what shared.
|
1 2 3 4 5 6 7 8 9 10 11 12 13 14 15 16 17 18 19 20 21 22 23 24 25 26 27 28 29 30 31 32 33 34 35 36 37 38 39 40 41 42 43 44 45 46 47 48 49 50 51 52 53 54 55 56 57 58 59 60 61 62 63 64 65 66 67 68 69 70 71 72 73 74 75 76 77 78 79 80 81 82 83 84 85 86 87 88 89 90 91 92 93 94 95 96 97 98 99 100 101 102 103 104 105 106 107 108 109 110 111 112 113 114 115 116 117 118 119 120 121 122 123 124 125 126 127 128 129 130 131 132 133 134 135 136 137 138 139 140 141 142 143 144 145 146 147 148 |
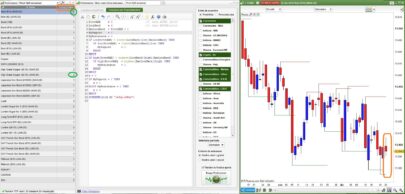
// Definizione dei parametri del codice DEFPARAM CumulateOrders = False DEFPARAM PRELOADBARS = 2000 DEFPARAM FLATBEFORE = 090000 DEFPARAM FLATAFTER = 173000 // No new trade after 17.00 TimeToStop = time < 170000 // No Trade 1 may, 24, 25, 26, 30 e 31 december, saturday and sunday GiornoTrading = NOT ((Month = 5 AND Day = 1) OR (Month = 12 AND (Day = 24 OR Day = 25 OR Day = 26 OR Day = 30 OR Day = 31) OR OpenDayOfWeek = 6 OR OpenDayOfWeek = 0)) ONCE LOTTO = 1 // nr of contracts ONCE NDBARLIMIT = 3 // nr of bars on which the buy stop or sell stop orders remains active ONCE DS = 40*LOTTO*PointValue // Daily Target Profit in € ONCE N = -2 // Daily Stop Loss = N*DS in € ATR = AverageTrueRange[5] VATR = (ATR[0]-ATR[5])/ATR[5] // Variazione dell'ATR rispetto a 5 barre prima S = ATR*5 // minimum stoploss T = 1 // Target profit = S*T // if volatility increase target profit increase IF VATR > 0 THEN T = T + (T * VATR) // Target profit = S*T ENDIF // Definition of inversion patterns : engulfing and pin bar BearishEng = close[1]>open[1] AND open[0]>=close[1] AND close[0]<open[1] AND close[0]<open[0] AND (close[0]-low[0])<(open[0]-close[0]) BullishEng = close[1]<open[1] AND open[0]<=close[1] AND close[0]>open[1] AND close[0]>open[0] AND (high[0]-close[0])<(close[0]-open[0]) PinSell = close[0]<open[0] and (high[0]-open[0])>=2.5*(open[0]-close[0]) and (close[0]-low[0])<2*(open[0]-close[0]) PinBuy = close[0]>open[0] and (open[0]-low[0])>=2.5*(close[0]-open[0]) and (high[0]-close[0])<2*(close[0]-open[0]) UP = BullishEng OR PinBuy DW = BearishEng OR PinSell HPAT = Highest[2](High) // HIGH of the pattern LPAT = Lowest[2](Low) // LOW of the pattern // At 9.00 at 11.00 at 13.00 at 15.00 it calculates Max and Min of n last bars IF TIME = 090000 OR TIME = 110000 OR TIME = 130000 OR TIME = 150000 THEN H01H = Highest[60](High) H02H = Highest[660](High) H03H = Highest[1020](High) H04H = Highest[1500](High) L01H = Lowest [60](Low) L02H = Lowest [660](Low) L03H = Lowest [1020](Low) L04H = Lowest [1500](Low) HMAX = MAX(H01H, MAX(H02H, MAX(H03H, H04H))) // Max of max LMIN = MIN(L01H, MIN(L02H, MIN(L03H, L04H))) // Min of min ENDIF // at 8.59 a.m. it calculates the entity of StrategyProfit IF TIME = 085900 THEN LASTPROFIT = STRATEGYPROFIT ENDIF // If not onmarket it calculates daily profit or loss IF NOT ONMARKET THEN DELTAPROFIT = STRATEGYPROFIT-LASTPROFIT // DEFINITION of SIZE of the POSITION to open // NOTE that to double the position is profitable only if the strategy has a percentage of trades in gain greater than or equal to 50% // for this to happen, the ratio (T) between stoploss and take profit must not be too high IF POSITIONPERF(1)>= 0 THEN SIZE = 1*LOTTO ENDIF IF POSITIONPERF(2) >= 0 AND POSITIONPERF(1) < 0 THEN SIZE = 2*LOTTO ENDIF IF POSITIONPERF(2) < 0 AND POSITIONPERF(1) < 0 THEN SIZE = 4*LOTTO ENDIF ENDIF // Condizioni per entrare long C0 = AverageTrueRange[1500](Close) > 3 and CLOSE > ExponentialAverage[21](Close) // minimun of volatility and direction C1 = (UP and LPAT <= L01H and HPAT > L01H) // price is rejected by the support C2 = (UP and LPAT <= L02H and HPAT > L02H) // price is rejected by the support C3 = (UP and LPAT <= L03H and HPAT > L03H) // price is rejected by the support C4 = (UP and LPAT <= L04H and HPAT > L04H) // price is rejected by the support C5 = (UP and LPAT > HMAX) // the price broke the resistance we buy on the pull back IF C0 and (C1 OR C2 OR C3 OR C4 OR C5) THEN OPENBUY = high[0]+1*Pointsize // price of entry MYINDEX = Barindex ENDIF IF Barindex>=MYINDEX+NDBARLIMIT THEN // after NDBARLIMIT bars the order buy stop is deleted OPENBUY = 0 ENDIF // Respect all the conditions to open order, We open it only if daily profit or daily stoploss have not already been exceeded IF OPENBUY > 0 AND NOT ONMARKET AND DELTAPROFIT<DS AND DELTAPROFIT>DS*N AND TimeToStop AND GiornoTrading THEN BUY SIZE CONTRACTS AT OPENBUY STOP // si fissano stoploss e targetprofit SL = (high[0]-low[0])/Pointsize+1 IF SL < S THEN SL = S ENDIF IF SL > 60 THEN SL = 60 ENDIF TP = SL*T IF TP > S*3 THEN TP = S*3 ENDIF SET STOP pLOSS SL SET TARGET pPROFIT TP ENDIF // Condizioni per entrare short C0 = AverageTrueRange[1500](Close) > 3 and CLOSE < ExponentialAverage[21](Close) // minimun of volatility and direction C21 = (DW and HPAT >= H01H and LPAT < H01H) // price is rejected by the resistance C22 = (DW and HPAT >= H02H and LPAT < H02H) // price is rejected by the resistance C23 = (DW and HPAT >= H03H and LPAT < H03H) // price is rejected by the resistance C24 = (DW and HPAT >= H04H and LPAT < H04H) // price is rejected by the resistance C25 = (DW and HPAT < LMIN) // the price broke the support we sell on the pull back IF C0 and (C21 OR C22 OR C23 OR C24 OR C25) THEN OPENSELL = low[0]-1*Pointsize MYINDEX = Barindex ENDIF IF Barindex>=MYINDEX+NDBARLIMIT THEN OPENSELL = 0 ENDIF // Respect all the conditions to open order, We open it only if daily profit or daily stoploss have not already been exceeded IF OPENSELL > 0 AND NOT ONMARKET AND DELTAPROFIT<DS AND DELTAPROFIT>DS*N AND TimeToStop AND GiornoTrading THEN SELLSHORT SIZE CONTRACTS AT OPENSELL STOP // si fissano stoploss e targetprofit SL = (high[0]-low[0])/Pointsize+1 IF SL < S THEN SL = S ENDIF IF SL > 60 THEN SL = 60 ENDIF TP = SL*T IF TP > S*3 THEN TP = S*3 ENDIF SET STOP pLOSS SL SET TARGET pPROFIT TP ENDIF |
Share this
No information on this site is investment advice or a solicitation to buy or sell any financial instrument. Past performance is not indicative of future results. Trading may expose you to risk of loss greater than your deposits and is only suitable for experienced investors who have sufficient financial means to bear such risk.
ProRealTime ITF files and other attachments :
Find other exclusive trading pro-tools on ![]()
PRC is also on YouTube, subscribe to our channel for exclusive content and tutorials


Ciao Fulvio,
ho scaricato ed importato il file.
m,a se lo faccio girare sul miniDax non apre nessun ordine !
cosa sto sbagliando ?
Attualmente non c’è sufficiente volatilità : la condizione “C0 = AverageTrueRange[1500](Close) > 3” non è verificata.
Ma io intendevo in backtest !
Scusa non l’ho menzionato.
salve fulvio .il trading sistem e sempre profittevole?