Hi all !
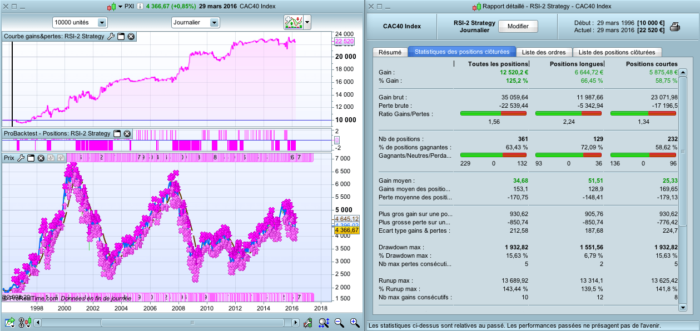
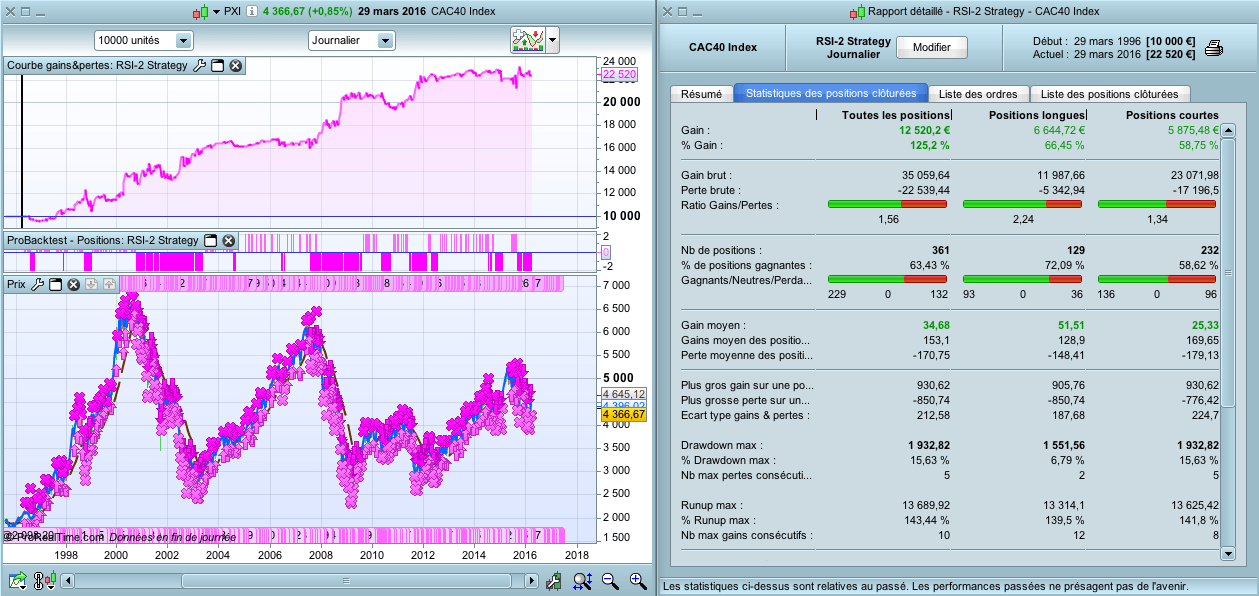
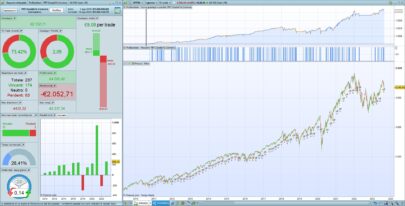
Here is the backtest that I made, from the « RSI-2 Strategy » of Larry Connors.
He’s also the co-author of the « Cumulative RSI » Strategy.
It took me 5 minutes to write the code, as the rules are very simple : no need to detail them.
Even if the strategy is positive on many stocks, indices, I don’t find it that great.
But you are free to test it and why not improve it.
The picture shows the CAC40 for the last 20 years.
Best Regards,
|
1 2 3 4 5 6 7 8 9 10 11 12 13 14 15 16 17 18 19 20 21 22 23 24 25 26 27 28 29 30 31 32 33 34 35 36 37 38 39 40 41 42 43 44 45 46 47 48 49 50 51 52 53 54 55 56 57 |
DEFPARAM CumulateOrders = False n = 2 // Conditions pour ouvrir une position acheteuse MM200 = Average[200](close) MM5 = Average[5](close) RSI2 = RSI[2](close) c1 = close > MM200 c2 = close < MM5 c3 = RSI2 < 10 IF c1 AND c2 AND c3 THEN BUY n SHARES AT MARKET ENDIF // Conditions pour fermer une position acheteuse c4 = close > MM5 IF c4 THEN SELL AT MARKET ENDIF // Conditions pour ouvrir une position en vente à découvert c1v = close < MM200 c2v = close > MM5 c3v = RSI2 > 90 IF c1v AND c2v AND c3v THEN SELLSHORT n SHARES AT MARKET ENDIF // Conditions pour fermer une position en vente à découvert c4v = close < MM5 IF c4v THEN EXITSHORT AT MARKET ENDIF |
Share this
No information on this site is investment advice or a solicitation to buy or sell any financial instrument. Past performance is not indicative of future results. Trading may expose you to risk of loss greater than your deposits and is only suitable for experienced investors who have sufficient financial means to bear such risk.
ProRealTime ITF files and other attachments :PRC is also on YouTube, subscribe to our channel for exclusive content and tutorials








Bonjour
ne pensez vous pas que ligne 41 il faudrait C3v >90 plûtot que C3v <90??
Félicitations pour ce site
Madrosat
There is an error at line 41.It should be :
c3v = RSI2 > 90
On the CAC40, it gives better result with the error…Sorry for it
My apologies to all :
with this new line, backtest show less brute gains, but far less drawdown and better profit factor (from 1,5 to >2).
Test it if you want 🙂
Here is the new picture :
http://www.doctrading.fr/wp-content/uploads/2016/03/RSI-2-strategy-n4.png
and the new backtest :
http://www.doctrading.fr/wp-content/uploads/2016/03/RSI-2-backtest-n4.png
more profitable !
Happy trading to all
Hi,
Sadly, as I thought, the results on 1mn UT are catastrophic 🙁 for Intraday trader
<a href=”http://zupimages.net/viewer.php?id=16/13/mnxk.png”><img src=”http://zupimages.net/up/16/13/mnxk.png” alt=”” /></a>
Hi,
Sadly, as I thought, the results on 1mn UT are catastrophic 🙁 for Intraday trader
Even for bigger Ut (here 15 mn)
http://zupimages.net/up/16/13/1e63.png
May be it will be optimize
RSI is an oscillator made for price centering. This strategy bet on mean reverting phenomena. I’m pretty sure that 2 bars of 1 minute can’t define this! 🙂
Hello,
You are right, this system isn’t designed for day trading.
In my opinion, RSI with short periods work well for daily candles (there are plenty of strategies with RSI2, RSI5, etc.), but not for intraday trading, where there can happen big moves.
Good start. Works decently during stock runaway bull market. I have tested it over 80 year period (DJ industrial) and it is not profitable during many years.
Hi – the way Larry trades it does not work – discovered that over 10 years ago! BUT If you trade it using specific price formations it works super well