Screener for Williams’s highs and lows

Screener for Williams’s highs and lows

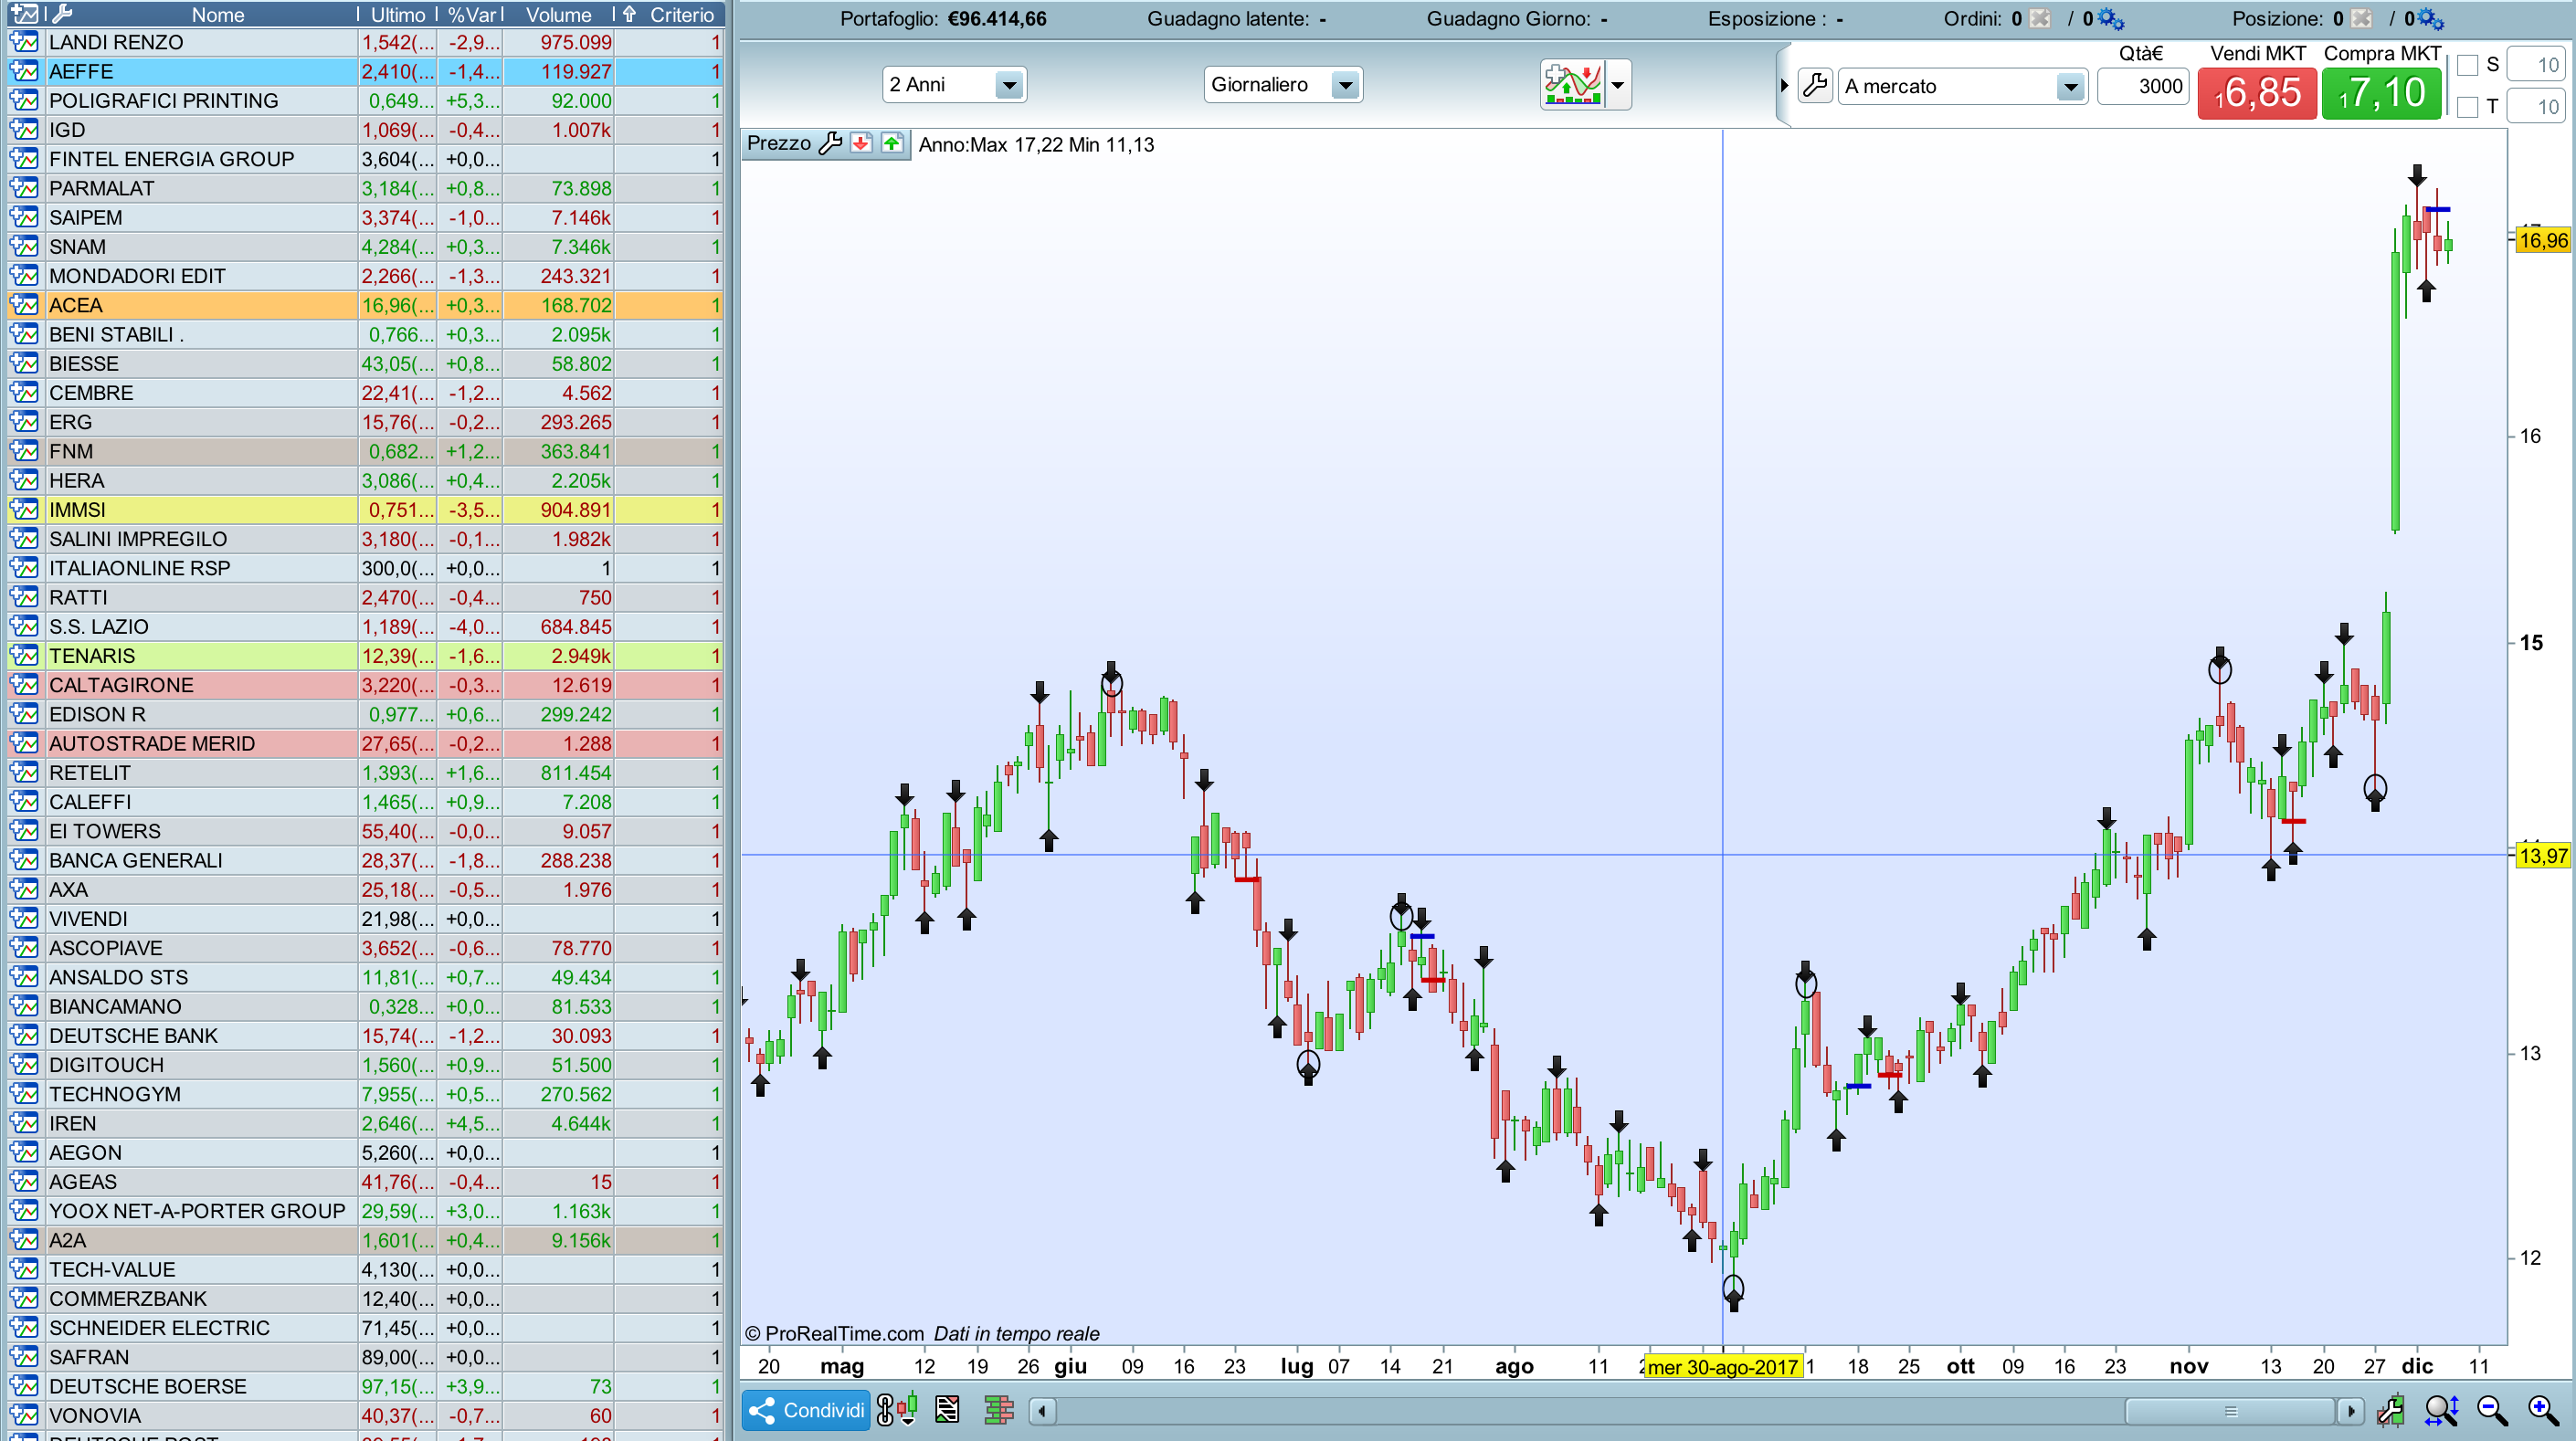
This screener complete the code I wrote at this link and helps to find the highs and lows as described by Williams.

Blue skies

Share this

Risk disclosure:

No information on this site is investment advice or a solicitation to buy or sell any financial instrument. Past performance is not indicative of future results. Trading may expose you to risk of loss greater than your deposits and is only suitable for experienced investors who have sufficient financial means to bear such risk.

ProRealTime ITF files and other attachments : How to import ITF files into ProRealTime platform?

PRC is also on YouTube, subscribe to our channel for exclusive content and tutorials

  1. eisi • 12/07/2017 #

    Ciao gabri! First of all thank u for publishing ur Screener. U wrote c1 is the long and c2 the short condition. So why is the Screener condition [c1 and not c2]? And if i would like to see if the Signal is long or short, like Go=1 for long and Go=-1 for short, how can i write that? Thank u in advance!

  2. gabri • 12/07/2017 #

    Eisi, I left both option open in case someone wants to screen for long and short. I could have slashed out the line with the C2 condition and screened only for C1, it would give the same results.

  3. Bard • 12/07/2017 #

    Hi Gabri, Thanks very much for your Williams’ coding indicators and screeners.

    With this screener I’m not sure how you know when/where it’s showing you the highs or lows, (I added screener [c1 AND c2] instead of long only), as there’s no drawings of flashing lines like other screeners?

    Your Williams’ High and Low indicator is pretty amazing! I was wondering though how you would code a system so that it took: long trades at the intermediate low swing ellipse points and
    intermediate high swing ellipse points? I have added the indicator code into the system but am unsure how to set the conditionality to buy and sell?
    Cheers

  4. gabri • 12/07/2017 #

    Bard, thanks for the comment. I don’t do automatic trading and I am not sure this indicator was created with the purpose of automatic trading. I believe this indicator is a good tool to assess swing points (Williams is a swing trader). I can work on your request and I will let you know.

  5. Bard • 12/07/2017 #

    Thank you so much @gabri.
    Are you using the indicator for live trading, I’m wondering how reliable it has been?

    I was interested to see how the “high and lows” indicator performed in a backtest because it just looks incredible on every chart I pull up from the £/$ to the Wall Street Dow.

    Screenshots of Wall St when it’s rising and since the Jan/Feb volatility shock:
    https://www.dropbox.com/s/98gik75u3x169j2/dow1.png?dl=0
    https://www.dropbox.com/s/fp3bo8ow9f0bq0w/dow2.png?dl=0

    The last time I go this excited by an indicator was when I read the research on this statistically sound and thoroughly backtested Cynthia Kase ATR/Standard Deviation Stop that Nicolas kindly coded at my request along with the Kase Peak Oscillator:
    https://www.prorealcode.com/prorealtime-indicators/kase-dev-stop-v3/
    https://www.prorealcode.com/prorealtime-indicators/kase-peak-oscillator-v2/
    Discussion: https://www.prorealcode.com/topic/kase-peak-oscillator-kase-cd-and-kase-permission/
    Kase Convergence / Divergence is meant to be used with the Peak Oscillator. It’s uncoded currently.

    Funny, I’ve had a copy of Williams’ book you mentioned on my Mac for ages. I’m reading it now!

  6. gabri • 12/07/2017 #

    Bard, I coded this indicators after reading the book written by Wiliams. I personally use the Wyckoff techniques. Williams (Larry first and then Michelle, his daughter) apparently won the trading world championship using also this technique. From what I saw it’s a strong indicator but I have no data associated with it and no backtesting done…sorry 🙁

  7. Bard • 12/07/2017 #

    Thanks for the tip Gabri, it looks like Wyckoff is mainly for stocks (which I don’t trade) but has some useful and interesting techniques that can be applied to currencies an other asset.

    I’m looking at when the Williams High Low Indicator will paint a new ellipse up (or down arrow), in terms of time elapsed before an intermediate ellipse/arrow is painted. If you’re looking at “intermediate lows” for example, (1 hour chart), it paints the ellipse up arrow after a candle is surrounded by higher short term lows either side of it.

    So am I right in saying that the very last green ellipse/intermediate low in this image:
    https://www.dropbox.com/s/i5a0xjqc0p7jv4b/IntermediateLow.png?dl=0
    won’t be painted until there are two green short term arrows either side of that candle and it will become a painted candle with an ellipse, (an intermediate low), only when that far right/last short term low green arrow, is drawn (i.e. where my crosshair is located), right?

    Also, I was wondering if could you please explain the meaning of this line:
    “if alto<alto[1] and trend=1 then trend=0" ?

    It'll be interesting to see how an automated strategy will cope with different timeframes so that it doesn’t take too long for the intermediate lows (highs) too form and when they do form, that the new bar you enter on hasn’t move so far from the ellipsed candle as to be not very profitable, (profit versus drawdown).

    Cheers,
    Bard

  8. gabri • 12/07/2017 #

    Bard,
    you are right on the way ellipsis and arrows are drawn. The line you mentioned is just to define the short term trend. It’s the quickest (and I am sure not the most elegant) way to do it. I am sure that someone smarter than me will be able to backtest this system like you suggest. I thought about applying this system on smaller timeframes as well but the waves are still entered with some delay and I believe that only the big ones might be really profitable.

  9. Bard • 12/07/2017 #

    Thanks that makes sense about the short trades.
    Yes it just occurred to me about how late the paint comes on these intermediate ellipses as I manually traded the £/$ daily from 1976 to 1980 and 2014 to present using these ellipses yesterday. Once a naming convention for the “ellipse event” has been figured out it should be possible to automate it I hope, (not trying to rush you!)

  10. Bard • 12/07/2017 #

    Hi @Gabri, I hope your trading’s going well. I wondered if you had found any time to write a line of code so that a system can take:
    long trades at the intermediate low swing ellipse point and short trades at the intermediate high swing ellipse points? I couldn’t figure a way of writing that ellipse event? Cheers.

  11. gabri • 12/07/2017 #

    Hi Bard, all is fine…just super busy. Unfortunately I haven’t had time to do that, it’s still in my pipeline though 🙂

  12. Bard • 12/07/2017 #

    How’s that pipeline looking @Gabri?
    Ps/ I updated Violets brilliant (Bulkowski) Patterns Indicator here:
    https://www.prorealcode.com/topic/8-high-probability-bulkowski-candlestick-patterns/#post-94519

  13. gabri • 12/07/2017 #

    Hi Bard, I have to be honest….I completely forgot about it 🙂 let me try to find some time and, just in case, remind me again in a month or so. Just to make it clear, are you looking to enter at the price level of the ellipse, when the ellipse paints or at the candle connected with the ellipse?

  14. Bard • 12/07/2017 #

    Hey Gabri, thanks for your message I don’t recall getting a notification for it so sorry for the lateness of my reply!

    Paper trading the Williams High/Low for the daily £/$ and even the 1 hour Dow, (although the 2 hour was better), performed profitably:
    Daily £/$ (1976-1980) £10k to £37.3k in 4 years with 20% drawdown.

    Daily £/$ (2014-2018) £10k to £35.7k in 4 years with 4% drawdown, (including a correctly pre positioned trade before the UK Brexit vote in June 2016 that netted 1284 ticks @£10/tick).

    Two Hour Dow Jones (June 2018 to Aug 2018) £10k to £41.7k in 3 months with 36% drawdown.

    I entered on the open the day after a confirmatory single arrow had formed an ellipse candle, because as I recall for example, the “ellipse up arrow” is only painted after a candle is surrounded by higher short term lows either side of it. Eg, I entered a trade on the open of the candle after the crosshair in this image that I previously posted above: https://www.dropbox.com/s/i5a0xjqc0p7jv4b/IntermediateLow.png?dl=0

    My paper system always netted off trades so I was either £10/tick long or short. So, if I ended up for example £20 short I would then (at the next candle after a long ellipse signal) close the short out by going £30 long. It’d be interesting to back test this, particularly as it performed well on a ranging asset like the £/$ and on a trending asset like the Dow. I’m thinking optimisation will probably also be made in the choice of timeframe so that profits aren’t whipsawed in flat markets with little up/down tick movement.

    • gabri • 12/07/2017 #

      @ bard: I forgot, your entry should have been 16 bars before the crosshair (I am not sure I counted right with the information box over imposed to the graph), where the hammer is surrounded by a long red and a long green.

  15. gabri • 12/07/2017 #

    Hi Bard, thank you for the feed back. I actually decided to code this indicator from scratch because the initial one was not satisfying. I will post the newest soon.

    Unfortunately I am getting stuck every time with the backtesting. It seems I cannot find a way to backtest this system automatically. I can do it manually but, unless you have long strides in one direction with good momentum, I am not satisfied with the results I get. I noticed that using the Accumulative Swing Index in combination with this indicator definitely improves the performances (I use ichimoku for trend detection)

  16. gabri • 12/07/2017 #

    Here’s the new code
    ib=highlow[j]
    once j=1
    once massimo1=close
    once massimo2=close
    once minimo1=close
    once minimo2=close
    once MTaltobarold=0
    once MTbassobarold=0
    once MTaltoold=close
    once MTbassoold=close
    delta=average[50](range)/10
    minimo=low>low[j] and low[j]<low[j+1]
    massimo=highhigh[j+1]
    //calcolo swing di breve
    if not(ib) then//and not(ob)
    if massimo then// 1
    DRAWTEXT(“▼”, barindex-j, high[j]+delta,dialog,bold,10) coloured (0,153,255)
    if high[j]massimo2 then// 2
    DRAWTEXT(“▼”, MTaltobarold, MTaltoold+2*delta,dialog,bold,15) coloured (210,0,0)
    endif// 2
    massimo2=massimo1
    massimo1=high[j]
    MTaltobarold=barindex[j]
    MTaltoold=high[j]
    endif// 1
    if minimo then// 1
    DRAWTEXT(“▲”, barindex-j, low[j]-delta,dialog,bold,10) coloured (0,153,255)
    if low[j]>minimo1 and minimo1<minimo2 then// 2
    DRAWTEXT("▲", MTbassobarold, MTbassoold-2*delta,dialog,bold,15) coloured (210,0,0)
    endif// 2
    minimo2=minimo1
    minimo1=low[j]
    MTbassobarold=barindex[j]
    MTbassoold=low[j]
    endif// 1
    j=1
    else
    j=j+1
    endif

    return

    • Bard • 12/07/2017 #

      Hi Gabri, thanks a lot for taking another look at this.

      I was wondering why does that trade need to be taken 16 bars back (where the hammer is surrounded by a long red and a long green)? I thought an ellipse won’t form until a single green up arrow has been established on what becomes the right hand side of the about to be painted in ellipse?
      (i.e. only when the ellipse is surrounded to the left and right by single green up arrows can it then be drawn).

      Is it very difficult to define that second right hand side arrow that allows an ellipse to be painted and use that right hand side arrow for an automated system to take a trade on the next candle? What happens when you try to code it?

      The original High/Low code was very profitable paper trading it! I notice the average has gone down from 200 to 50 and the range was divided by 4 but now 10, surely won’t that have a big impact on the profitability?

      I also got a syntax error when trying to load the new code? Pls see screenshot: https://www.dropbox.com/s/b8urc153req4t9n/WilliamsHi%3ALoError.png?dl=0

      Btw, what does MTaltobarold and MTbassobarold mean?

      Cheers once again, much appreciated,

      Best
      Bard

      Ps/ I don’t get notifications of replies here, did you get one when I wrote to you?

  17. gabri • 12/07/2017 #

    Hi Bard,
    line 18 should read:

    if high[j]>massimo2 then

    There used to be a box to check to see notification but sometimes it is enough to have @(name of the person) in the text.

    In the previous code I didn’t like the way inside bars were computed. In this new code they are working better. The entry should be before because the intermediate arrow is actually computated earlier (if you load both codes, the old and the new on the same stock you will see what I mean).

    MTaltobarold and MTbassobarold are used to store information about the value of the old highest and lowest point (unfortunately this software won’t allow arrays).

  18. Bard • 12/07/2017 #

    Thanks Gabri

    I get an error saying the highlow and highhigh need defining?

    Is there a reason for the different averages and radius now used? Does using the old setting of 200 and 4 perform as well as the new indicator?

    It will be interesting to compare the two indicators because I still can’t figure out what you meant by “16 bars before the crosshair!“

    The reason why I’m still unclear why that is, is because an ellipse is only painted after a second green arrow — of two arrows either side of an ellipse — is painted to it’s right.
    I.e. where the crosshair is in my dropbox image.

    How can the trade be taken 16 bars before if the the second arrow has yet to appear? The second arrow has to form first to then allow the system to paint an ellipse, no? Only at the second arrow can a trade be taken because how would the system know in advance that a second (of two) arrows is going to form an ellipse!

  19. gabri • 12/07/2017 #

    Hi Bard, the second arrow should have appeared 16 bars before. You can write me at ggabri@me.com, it will be easier to talk 🙂

  20. Bard • 12/07/2017 #
  21. dertopen • 12/07/2017 #

    @gabri
    hi Gabri i get the same error:
    define highlow and highhigh
    whic are the good numbers?
    thanks

  22. luigiR • 12/07/2017 #

    ciao gabri complimenti per il tuo lavoro, ti chiedo una cortesia cosa devo scrivere nel codice per fare apparire 1 = segnale long e -1 = segnale short ? grazie infinite

avatar
Register or

Likes

avatar avatar avatar avatar avatar avatar avatar avatar avatar avatar avatar avatar avatar avatar avatar
Related users ' posts
denmar Thank you
Xenotrax A première vue, sa à l'air d'être un indicateur très puissant sur de petites temporalités, j...
merri Bonjour Nicolas, Comment transformer cet indicateur en bot sur PRT ?
Nicolas Cela a déjà été fait, voir ce sujet: https://www.prorealcode.com/topic/strategia-con-lindica...
venugopal Hi Nicolas, Thanks for this code. Is it possible to build a screener using this indicator?. ...
Nicolas It has been done in that topic. Enjoy.
Abouadam2 EFFICACE
woktrade Superbe !
Vonasi An updated version with a bug fix can be found here: https://www.prorealcode.com/topic/dis...
snucke hey Vonasi is it possible you can help me get this indicator to show how much a market mo...
mmoren44 no esta el color azul (Fade //Blue), No aparece en las barras el color azul.
larouedegann changer fade coloured (0,0,255)
Bard "Bacon with speed" is a new one on me, Apologies, the link was not working on my iphone ...
TAC Bolsa I already published it ... in prorealcode ... Next time ... request a change of programmi...
TAC Bolsa I already published it … in prorealcode … https://www.prorealcode.com/prorealtime-indicator...
Geronima Ortiz okay bien estaré pendiente en esta pagina gracias
Domenec Aqui dejo colgado link del video para ver como funciona el indicador https://www.youtube....
Geronima Ortiz Gracias Domenec
Bard Thanks for sharing this Verdi55. More instructions from Larry Williams website (and a fea...
Violet Abz, the arrows and circles are only the *first part* of a trade setup. If certain conditio...
gabri Violet, you did an excellent job. I attached here https://www.prorealcode.com/prorealtim...
fab.ub HI GABRI, if the cirled arrow is the intermediate point in which You can define your entry a...
Matt B RolanBay, L'ellipse apparaît-elle à la bougie notifiée et reste ?
gianlucapegaso scusa Gagry ma il programm da copiare è quello con tutte le modifiche di cui ho letto nei va...
Valentinocorse bonjour a tous , superbe travail j'aimerai si possible une indication pour modifier l'indic...
GraHal Please forgive the daft question, but why is 3-bars-trailing-stop-williams-3.itf included a...
Kris75 Hi, Seems great but what would be the code for a stock ? Thanks, Chirs
oakenstream Paul, what is the best way in your opinion to know if I have over optimized?
Al Ok grazie Gabri
Paul thnx for posting. Combine it with Williams’ 3 bar trailing stop to create strategy!
gabri Paul, he uses the best day of the week to trade (he figured out the best day to enter, exit...
Mr_Balagan Bonjour, j'ai quelques questions concernant cette combinaison d'indicateurs qui à l'air inté...
larouedegann STE : Fonction statistique "erreur standard" de séries temporelles de N périodes pour le pri...
Mr_Balagan Merci pour ces informations précieuses larouedegann. J'y vois plus clair. Encore joli boulot
reb Hello Marc your strat seems very intersting, will take a look Reb
897148 What exactly is meant by Total price? Is r1 =28 in your example the no of days for "Total P...
Nicolas
7 years ago
Haos Visual
Haos Visual
8
Indicators
Lyny @Nicolas, how can i put this code in ProOder when for example i want to buy 1 share with con...
Nicolas Please open a new topic on forums for coding requests, I'll help you there. 
Johan Swarts Lyny / Nicolas Please advise whether you proceded with the code in ProOrder and if so where...
Nicolas The code is correct, don't know if the label and color are the same as other trading softwar...
peppe novellino Hi Nicolas, the settings of the alligators are not editable. How can I change it? Thanks in ...
pabo_swe I got very bad performance with this script, it was slow... it seems like if one breaks out ...

Top