




More from ProRealCode
ProRealCode - Trading & Coding with ProRealTime™
The ProRealTime™ community on the web! Officially sharing ProRealTime knowledge to Worldwide users since 2015!



Advanced Get Oscillator
June 30, 2022, 8:06 AM
Indicators
4 Comments
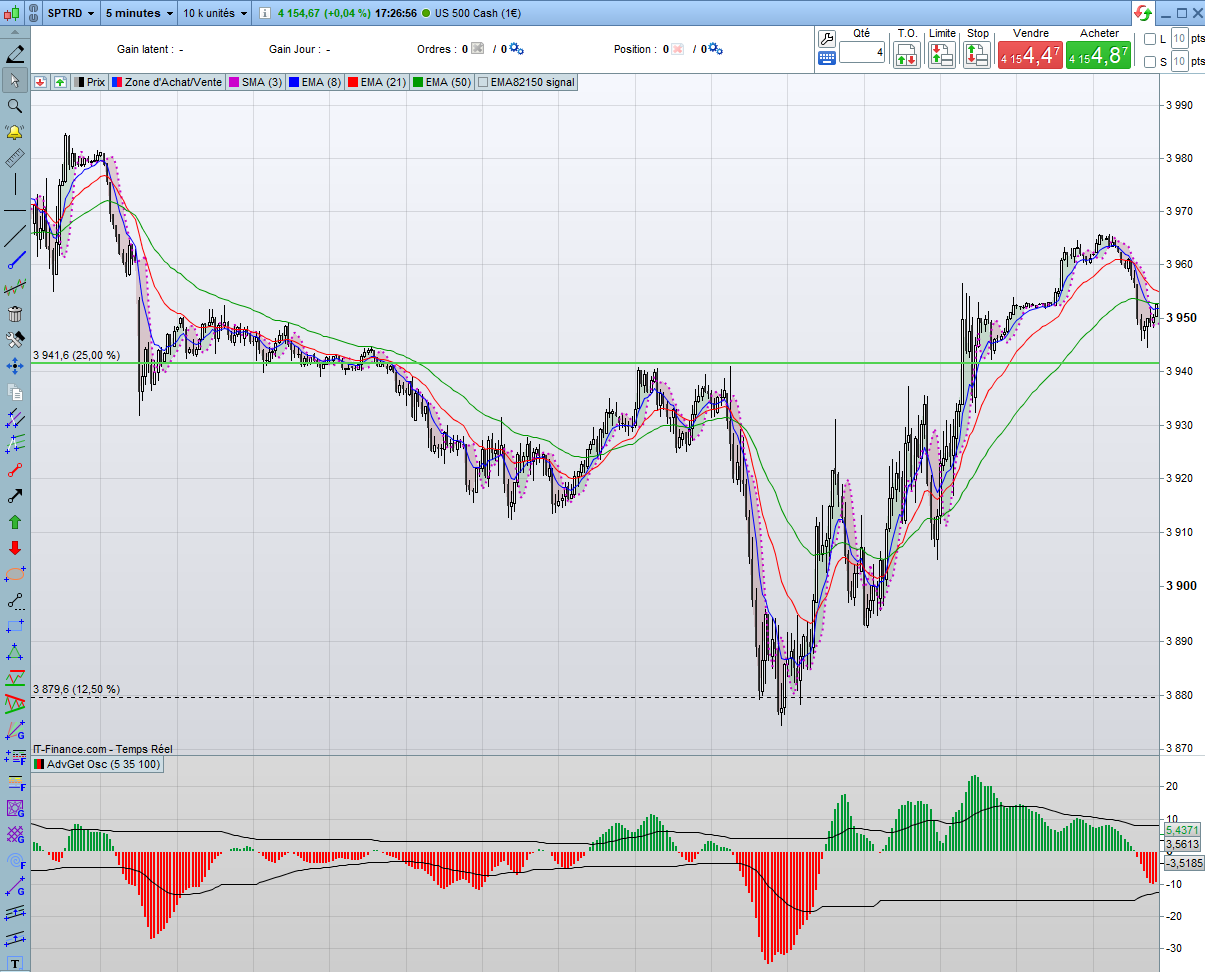
This indicator is nothing else than the classical Williams oscillator, set to 5 and 35, BUT with the addition of those signal bands above and below 0.
Here is a formula inspired from an AFL for Amibroker and converted into PRT language; those bands are supposed to indicate an acceleration up/down when prices break above the upper band or below the lower band, and a loss of volatility when it stays in between. Also, in term of Elliott Wave, it also helps to point when a W4 correction is over, when prices retrace over 80% of their previous peak (trough) aka close or even beyond zero.
Here is the code:
defparam calculateonlastbars = 4000
// ---------------
BobStrength = 5
oscfast  = 35
oscslow = 100
// ---------------

if barindex>oscslow then
MP=(High+Low)/2
OscAG= average[oscfast](MP)-average[oscslow](MP)
Lens=Oscfast+Oscslow
Pr = 2.0/Lens

//once uprline = OscAG
//once lwrline = OscAG

if OscAG>0 then
UprLine = OscAG*pr+UprLine[1]*(1-pr)
LwrLine = LwrLine[1]
r=0
g=255
else
UprLine = UprLine[1]
LwrLine = OscAG*pr+LwrLine[1]*(1-pr)
r=255
g=0
endif
endif

return OscAG as "AGet OSc" style(histogram) coloured(r,g,0), uprline+(BobStrength/100)*UprLine as "Upr", lwrline-(BobStrength/100)*LwrLine as "Lwr"
Download
Filename:
Williams-Oscillator-with-Bands.itf
Downloads:
168
Average
Developer by day, aspiring writer by night. Still compiling my bio... Error 404: presentation not found.
Author’s Profile
Similar code
Bill Williams AlligatorIndicators
Best day to enter/exitIndicators
Fractal Williams IndicatorIndicators
Williams% signals on chartIndicators

Bill Williams ProfitunityIndicators


Loading...
i think the input values are a mistake....it should be
BobStrength = 100
oscfast = 5
oscslow = 35