Oversold Stocks With Rising Momentum

Oversold Stocks With Rising Momentum

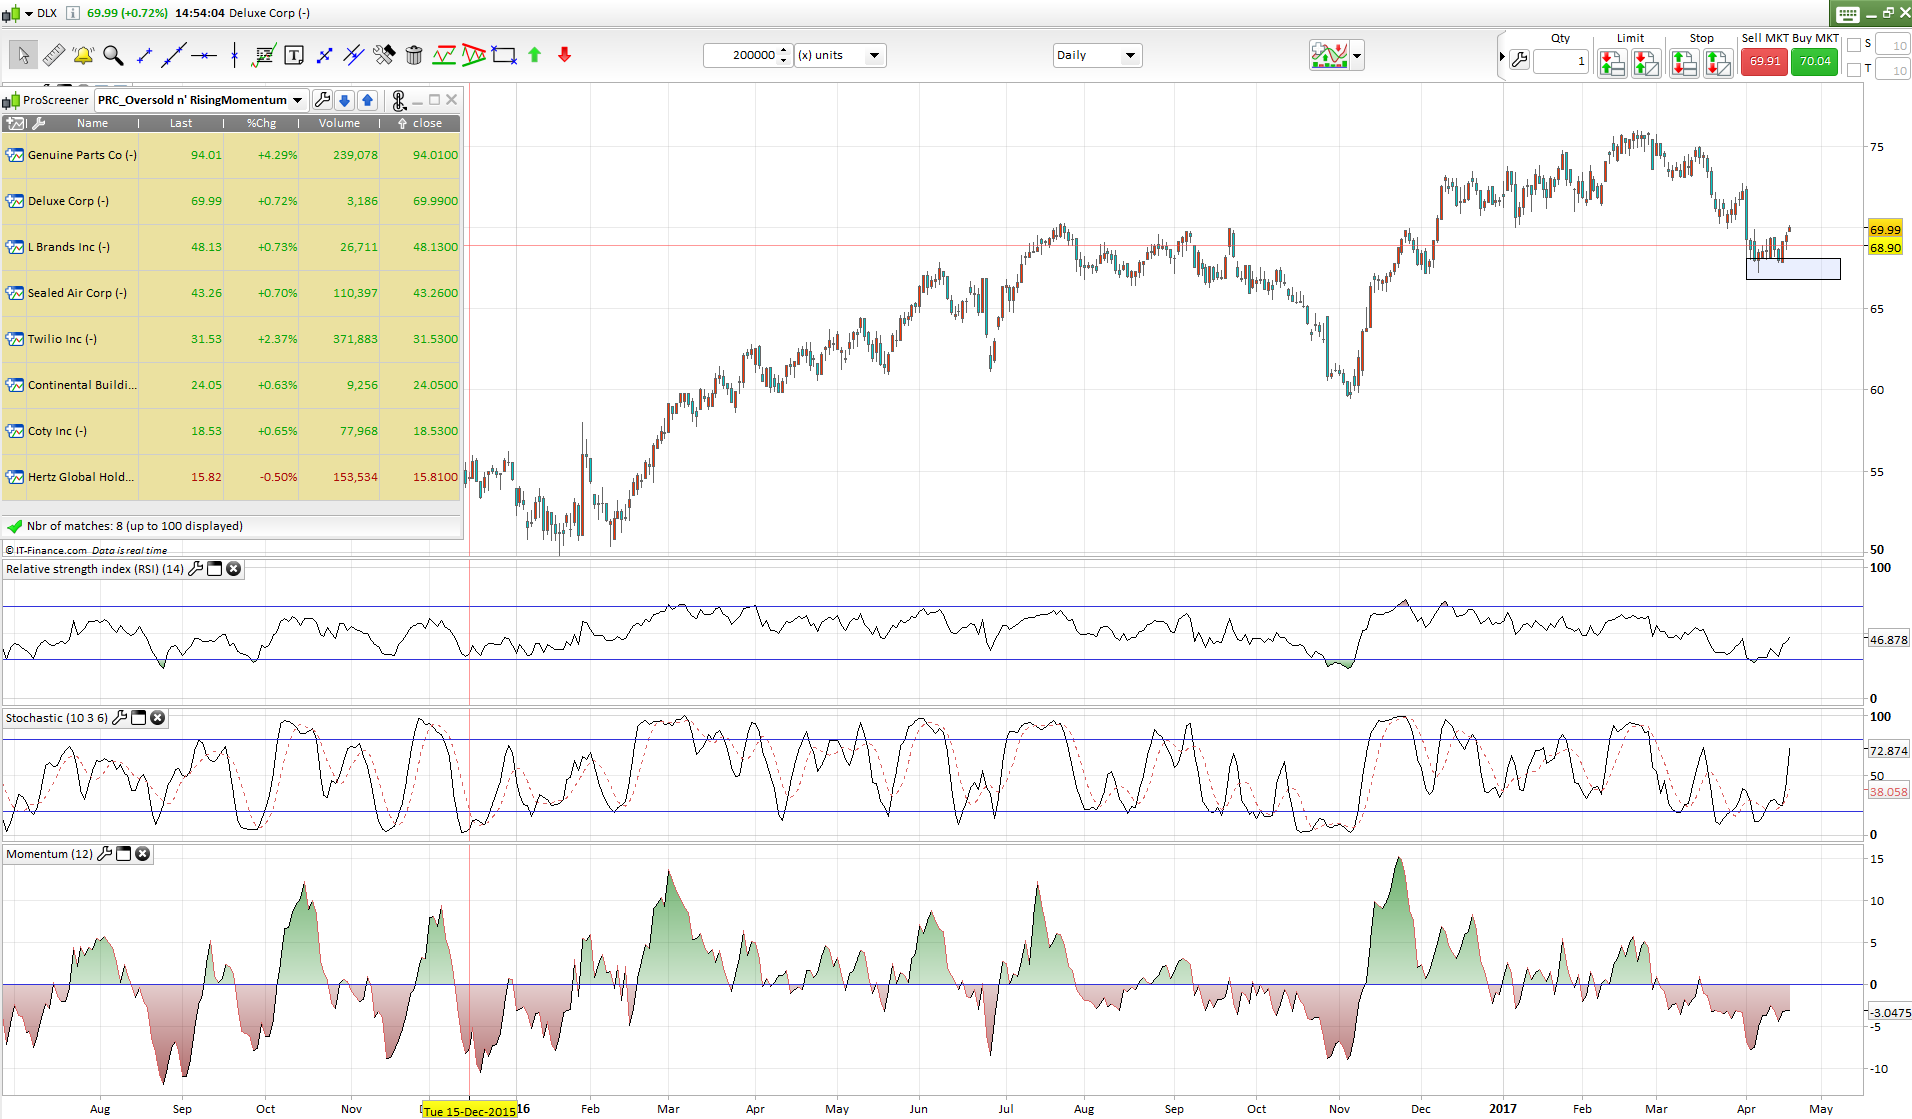
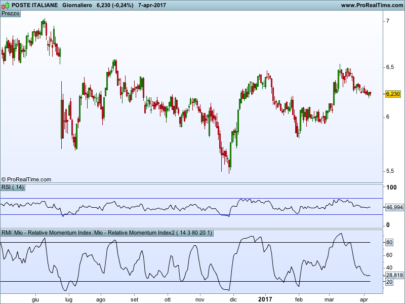
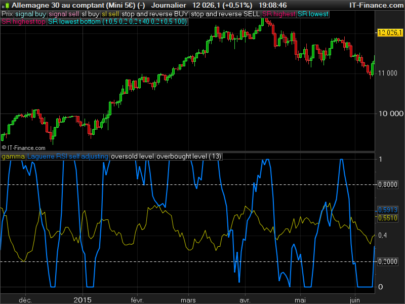
This stock screener find stocks that are/were in oversold territory by finding if their RSI and Stochastic were below the 30 and 20 percent level within the last “period” (10 days = setting that can be changed in the code).

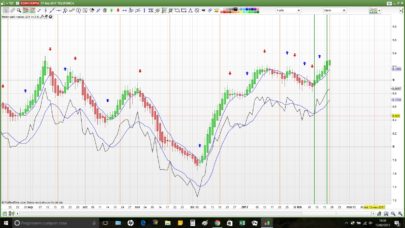
If the stocks is currently rising from its last bottom and if it was stopped on a ‘sweet spot’ (support levels of any kind), it may be a suitable level to buy the stock. The screener is catching a new momentum rising in the last ‘period’ bars to confirm the beginning of a new bullish momentum.


Share this

Risk disclosure:

No information on this site is investment advice or a solicitation to buy or sell any financial instrument. Past performance is not indicative of future results. Trading may expose you to risk of loss greater than your deposits and is only suitable for experienced investors who have sufficient financial means to bear such risk.

ProRealTime ITF files and other attachments : How to import ITF files into ProRealTime platform?

PRC is also on YouTube, subscribe to our channel for exclusive content and tutorials

  1. Francesco78 • 04/19/2017 #

    Thank you Nicolas! Exactly what I was looking for 🙂
     

  2. rafa • 04/19/2017 #

    How can we have this on overbought?
    Thanks in advanced

    • Nicolas • 04/19/2017 #

      All conditions under parenthesis for the c1 to c4 conditions should be inverted. 

  3. tomus • 04/19/2017 #

    Can you give an example of the overbought codes please? Thanks.

  4. ams123 Frank • 04/19/2017 #

    Merci Nicholas -:)

avatar
Register or

Likes

avatar avatar avatar avatar avatar avatar avatar avatar avatar avatar avatar avatar avatar avatar avatar avatar

+9 more likes

Related users ' posts
wtangsiri Bonjour J'ai importé le fichier ITF en question, mais cela me donne, en bas de l'écran, un...
Nicolas Il faut ajouter l'indicateur sur le graphique du prix.
skuggan89 This is a great indicator, works very well!! Is there any algo based on this indicator that ...
gabri
8 years ago
Marcel Thank you for this one. I played around with this indicator with Bollinger Bands around it i...
owes29 Hi is there anyway to develop this for the pro scanner on daily or hourly scans. so it woul...
Nicolas Of course, please add a query in the proscreener forum.
Bruno Carnazzi C'est dommage, cette histoire d'énergie fractale bousille complètement la précision de l'ind...
wtangsiri Bonsoir Qu'appelez vous l'axe vertical et comment le définir ? Merci pour votre aide.
rafadonl2 Pardonnez-moi mais je ne sais pas ce que vous entendez par "axe vertical". Serait-ce la lig...
rafadonl2 Je viens de voir ce que vous voulez dire. Comme pour tout autre indicateur, vous devez défin...
gregus bonjour a tous quelqu un pourait il recodé en prt il sagit  du dynamique zone ma, je n arri...
Nicolas Merci de faire une requête spécifique sur le forum. 
Nicolas
9 years ago
StepRSI
StepRSI
5
Indicators
Nicolas Thanks for this modification, I still do not have tested it, where did you get this idea to ...
rfsteve Trial and error from study of indicators call it coding mad science was trying to find an in...
Maxime Baudin Nice! Thanks :)
Nicolas
9 years ago
supertiti bonjour à tous J'utilise cet indicateur depuis plusieurs mois, une fois règlé "K" à sa conv...
Nicolas
9 years ago
GraHal Forked code I mention above is here ... GraHal wrote: So below is the PRC Stochastic RSI v...
GraHal Try again (quite limited what you can do as Comments in the Library) https://www.prorealco...
AutoFlanders Thanks GraHal, that's what i was looking for
Nicolas
9 years ago
T3 Velocity
T3 Velocity
16
Indicators
tatankayotanka As you can do to set a marker directly in the price property page and then view it such as m...
Nicolas It may be a good idea to discuss this in the forum instead. Please open a new topic in probu...
Wester Hi, is this more or less the same as the TTM Squeeze indicator (john carter)
Etienne Hi, I'm quite late in this thread. I'd just like to propose an enhancement because this in...
Nicolas Thanks Etienne.
Bard Hi Nicolas, I wanted to make this scaled indicator above between -1 and +1 instead of 0 to +...
Madrosat Bonjour Nicolas Je souhaiterais faire colorier le fond du graphique supérieur en vert lorsq...
Nicolas Merci d'ouvrir un sujet dans le forum approprié.
Nwab Hello Mr Nicolas.. Please how can I set this up as an indicator to work on mt5. Your guidan...
Dimi.A Awesome mate.
mora87 Hi David and Nicola, I'd like to share idea with you guys which is related to David's Idea. ...
Nicolas Please ask for custom coding in forums instead.
jeanphi0034 Hello, I would like to use the QQE indicator which is based on smooth RSI as far as I unders...
ilstefano Bonjour Nicolas, te serait il possible de rajouter la fast ATR manquante dans le code? Merci
Nicolas Désolé je ne comprends pas la question ?
rpreviteri Hi Nicolas, thanks a  loto for sharing your knowliedge, Wasn't the original momentum pinball...
air Thank you!  
elanoa Buonasera sig. Nicolas......sarebbe possibile far in modo che quando l'indicatore raggiunga ...
MikeGC I don't know if you have used the variables a and b to optimise the parameters for the Super...
gianpiero75 I have not optimized, I multiplied the parameters for 6 (5,8), to use them on the 4  hoursTF...
bertrandpinoy bonjour Mike j utilise TrendChaser V2.0 et quand il prend position cela ne programme pas le ...
zilliq The reasons why I think it's time consuming and we loose time to try to do backests and Auto...
filiprb Hello Zilliq, You don't need a system to produce a walk forward test. You can easily create...
Philip Raphael It is incredible! Thanks for sharing, Doctrading!
s00071609 Hi, could you please suggest, what this codes gives, lowest[b](rsi[a]) -- just trying to us...
Nicolas lowest[b](rsi[a]) returns the lowest values of the RSI of "a" periods, over the last "b" per...
s00071609 Hi, what would be the code to get the price for last bullish DTOSC cross over. I am looking ...

Top