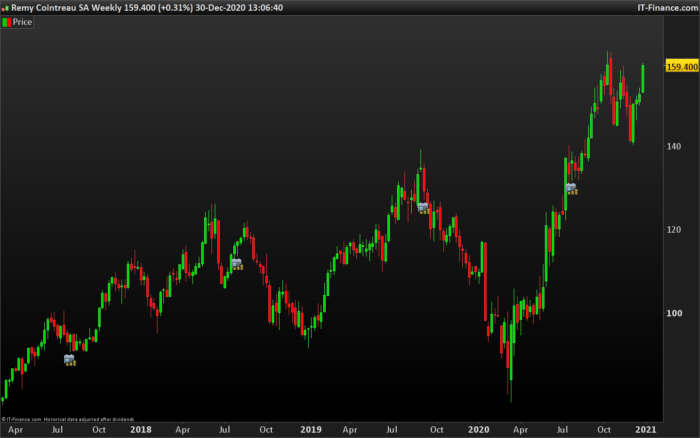
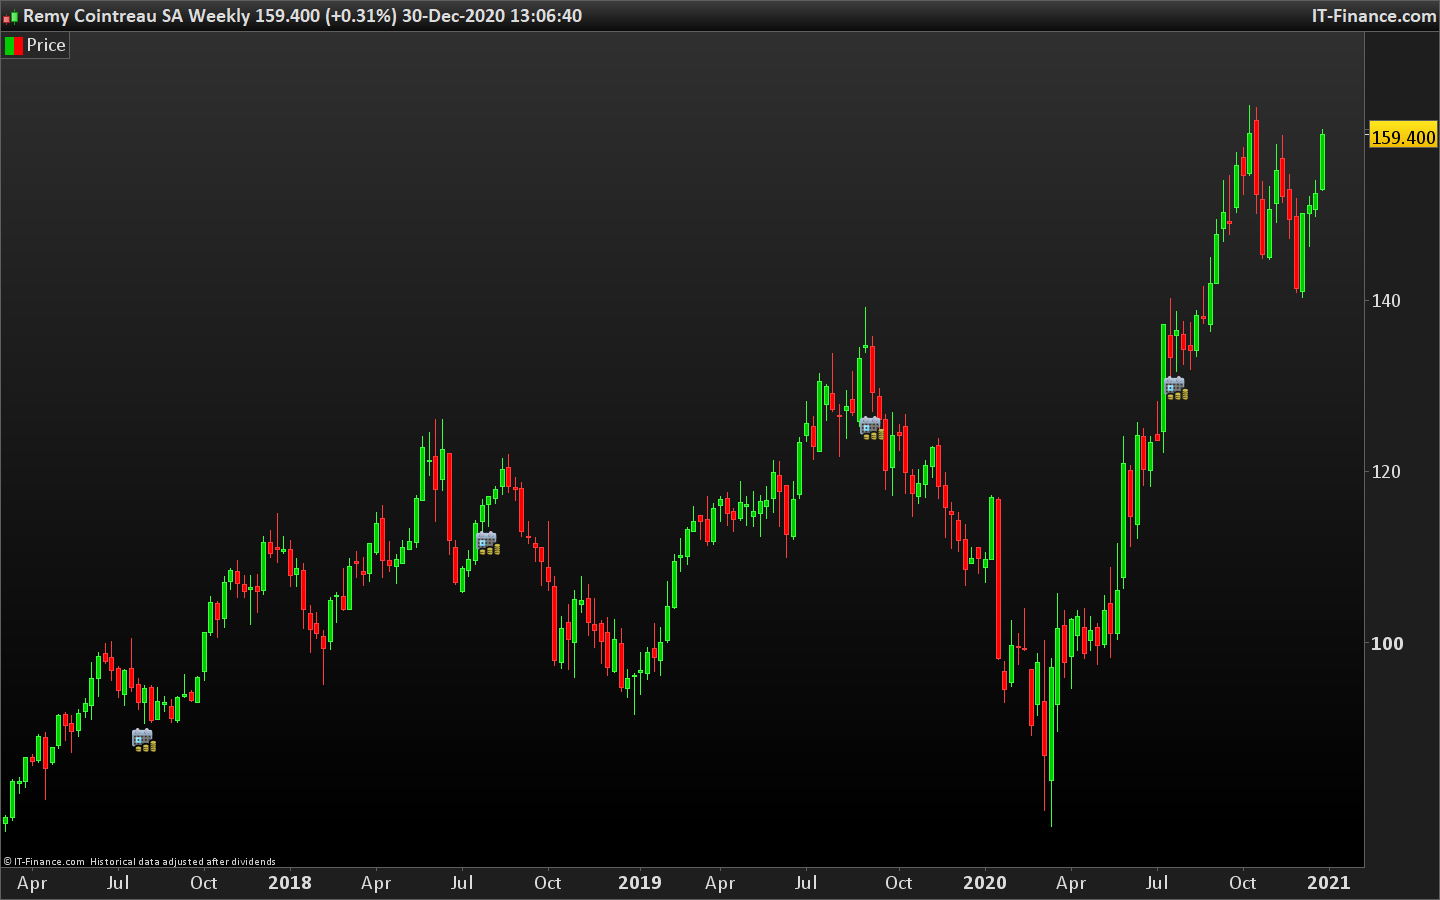
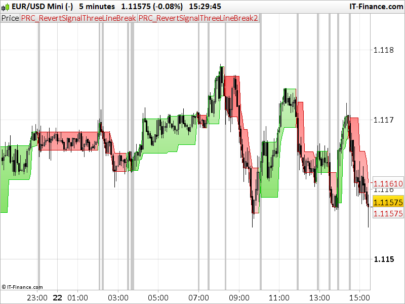
Here is a screener that will detect 3 Lines Breakouts. It has to be tuned to fit your needs : change the ScreenerBehavior variable to the value that you target : 1 = bullish breakouts, 0 = bearish breakouts , 2 = all breakouts.
|
1 2 3 4 5 6 7 8 9 10 11 12 13 14 15 16 17 18 19 20 21 22 23 24 25 26 27 28 29 30 31 32 33 34 35 36 37 38 39 40 41 42 43 44 45 46 47 48 49 50 51 52 53 54 55 56 57 58 59 60 61 62 |
// Change the below variable to change the screener behavior // 1 = bullish breakouts // 0 = bearish breakouts // 2 = all breakouts once ScreenerBehavior=1 // Trend=0 mean that the current block is red // Trend=1 mean that the current block is green once Trend=1 // On each candle the breakout are put to false Breakout=0 if (close > Chand1PH and Trend=1) then Chand3PB=Chand2PB Chand3PH=Chand2PH Chand2PB=Chand1PB Chand2PH=Chand1PH Chand1PB=Chand1PH len=len+1 if (len > 3) then len=3 endif Chand1PH=close elsif (close < Chand1PB and Trend=0) then Chand3PB=Chand2PB Chand3PH=Chand2PH Chand2PB=Chand1PB Chand2PH=Chand1PH Chand1PH=Chand2PB len=len+1 if (len > 3) then len=3 endif Chand1PB=close elsif (Trend=1 and ((close < Chand3PB and len=3) or (close < Chand2PB and len=2) or (close < Chand1PB and len=1))) then Chand3PB=Chand2PB Chand3PH=Chand2PH Chand2PB=Chand1PB Chand2PH=Chand1PH Chand1PB=close Chand1PH=Chand2PB len=1 Trend=0 if (ScreenerBehavior = 0 or ScreenerBehavior = 2) then Breakout = 1 endif elsif (Trend=0 and ((close > Chand3PH and len=3) or (close > Chand2PH and len=2) or (close > Chand1PH and len=1))) then Chand3PB=Chand2PB Chand3PH=Chand2PH Chand2PB=Chand1PB Chand2PH=Chand1PH Chand1PH=close Chand1PB=Chand2PH len=1 Trend=1 if (ScreenerBehavior = 1 or ScreenerBehavior = 2) then Breakout = 1 endif endif screener[Breakout] |
Share this
No information on this site is investment advice or a solicitation to buy or sell any financial instrument. Past performance is not indicative of future results. Trading may expose you to risk of loss greater than your deposits and is only suitable for experienced investors who have sufficient financial means to bear such risk.
ProRealTime ITF files and other attachments :
Find other exclusive trading pro-tools on ![]()
PRC is also on YouTube, subscribe to our channel for exclusive content and tutorials
Buenos Dias,
He estado ojeando el código de programación, y no entiendo las variables que usas. En concreto estas:
if (close > Chand1PH and Trend=1) then
Chand3PB=Chand2PB
Chand3PH=Chand2PH
Chand2PB=Chand1PB
Chand2PH=Chand1PH
Chand1PB=Chand1PH
len=len+1
if (len > 3) then
len=3
endif
Chand1PH=close
el screener tiene como objetivo localizar pautas planas del tipo ABC?
Gracias por el aporte.
Hello,
The variables ChandXXXX are for the lines in the 3 Lines Break indicator. PB is for the low and PH is for the high of each line.
It is not related to ABC patterns but to 3 Lines Break chart visualization you can lean more about it here : https://school.stockcharts.com/doku.php?id=chart_analysis:three_line_break
Here is the updated screener with variables that are more understandable:
https://www.prorealcode.com/topic/three-line-breakouts/#post-155918
Hi
What should be added in the code in order to limit the price range of the shares it displays?
For example I want it to display only stocks in the range between 10 and 300 dollars.
Thank you