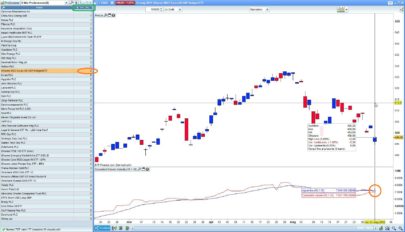
VOLUME FLOW INDICATOR (VFI) Provided By : MARKOS KATSANOS Copyright 2004
VFI,introduced by Markos Katsanos, is based on the popular On Balance Volume (OBV) but with three very important modifications:
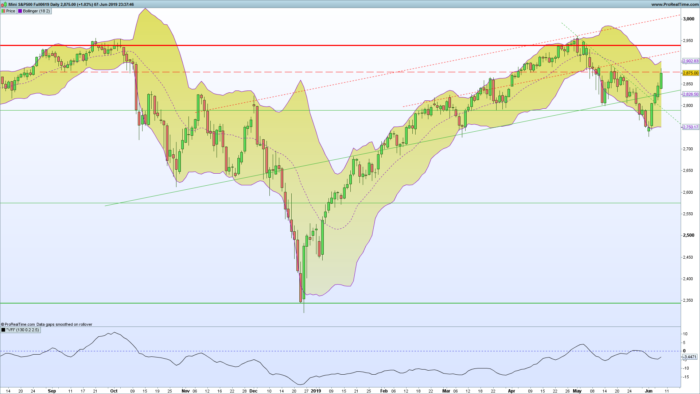
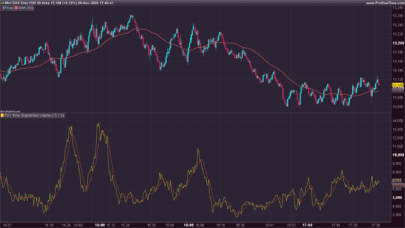
* Unlike the OBV, indicator values are no longer meaningless. Positive readings are bullish and negative bearish .
* The calculation is based on the day’s median (typical price) instead of the closing price.
* A volatility threshold takes into account minimal price changes and another threshold eliminates excessive volume .
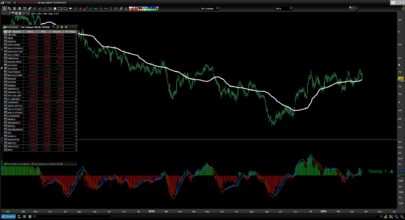
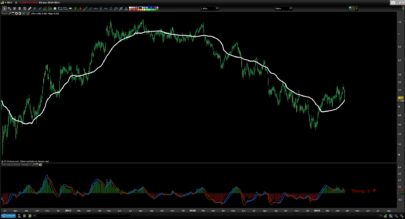
A simplified interpretation of the VFI is:
* Values above zero indicate a bullish state and the crossing of the zero line is the trigger or buy signal.
* The strongest signal with all money flow indicators is of course divergence.
For more information see Markos Katsanos’s articles in the
June 2004 and July 2004 issues of Technical Analysis of Stocks & Commodities magazine.
Period=days for VFI calculation
Coef=coefficient for minimal price cut-of (use 0.2 for daily and 0.1
for intraday 5-15 min data)
Vcoef=coefficient for volume cut-off (use 2.5 for daily and 3.5 for intraday charts)}
|
1 2 3 4 5 6 7 8 9 10 11 12 13 14 15 16 17 18 19 20 21 22 23 24 25 26 27 28 29 30 31 32 33 34 35 36 37 38 39 40 41 42 43 44 45 46 47 48 49 50 51 |
// VFI By Zilliq // // Period=130 (corresponding to 6 months) // Coef=coefficient for minimal price cut-of (use 0.2 for daily and 0.1 for intraday 5-15 min data) // Vcoef=coefficient for volume cut-off (use 2.5 for daily and 3.5 for intraday charts)} Period = 130 Coef=0.1 Vcoef = 3.5 TP = TypicalPrice if TP > 0 and TP[1] > 0 then Inter = Log(TP) - Log(TP[1]) else Inter = 0 endif //inter=log(typicalprice)-log(typicalprice[1]) vinter=STD[30](inter) cutoff=coef*vinter*close vaveset=average[period](volume) vave=vaveset[1] vmax=vave*vcoef if volume<vmax then vc=volume else vc=vmax endif mf=typicalprice-typicalprice[1] if mf>cutoff then vc=vc elsif mf<-cutoff then vc=-vc else vc=0 endif vfii=summation[period](vc)/vave vfimov=exponentialaverage[3](vfii) return vfimov as "VFI" |
Share this
No information on this site is investment advice or a solicitation to buy or sell any financial instrument. Past performance is not indicative of future results. Trading may expose you to risk of loss greater than your deposits and is only suitable for experienced investors who have sufficient financial means to bear such risk.
ProRealTime ITF files and other attachments :
Find other exclusive trading pro-tools on ![]()
PRC is also on YouTube, subscribe to our channel for exclusive content and tutorials


Apirine also offers a very interesting update of the OBV…