Hi Coders,
This is an improved version of 2 indicators made by Nicolas and unified and modified by myself.
(https://www.prorealcode.com/topic/prc_quickfibtl/)
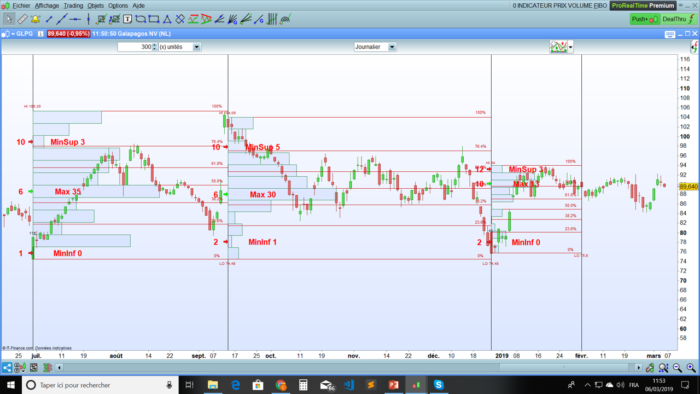
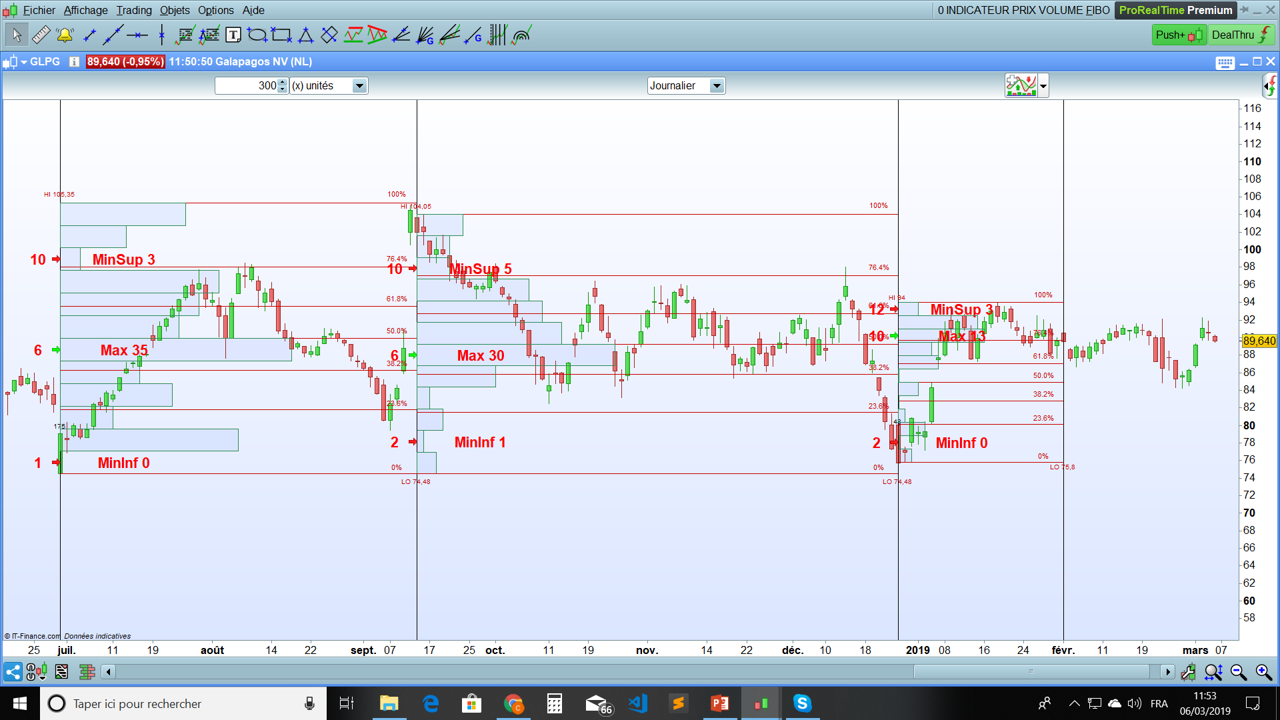
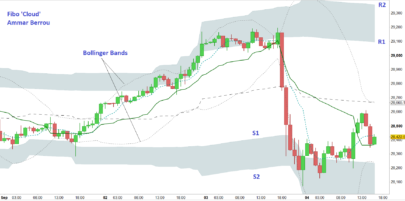
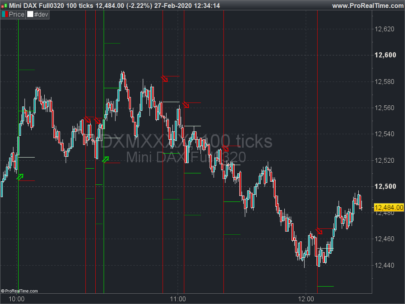
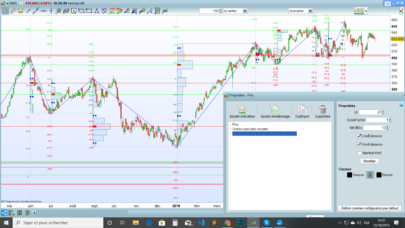
I needed further options to develop a simple strategy: identify strength and weakness in the distribution of volume per price :
- Max (strong level of volume per price => resistance or support depending on the position of the price)
- MinSup (week segment of price above the Max)
- MinInf (week segment of price under the Max=
The first idea behind is that if the price crosses over (respectively under) the strong volume level (“Max”), the price will tend to test a week point in the distribution of volume per price, respectively either superior (“MinSup”) or inferior (“MinInf”).
A second idea would be to use a section of StartHighest/EndLowest (respectively StartLowest/EndHighest) to set entry point if the price crosses over MinInf (respectively MinSup) and use Fibonacci to have a trailing stop.
I will open a new thread in ProOrder so that we can discuss this;
Please feel free to give to this code some enhancements or correct it if you see errors.
>>> Next steps :
- to automatise the sequences with new LowestLows and HighestHigh that we do here manually: any idea guys?
Enjoy
Chris
|
1 2 3 4 5 6 7 8 9 10 11 12 13 14 15 16 17 18 19 20 21 22 23 24 25 26 27 28 29 30 31 32 33 34 35 36 37 38 39 40 41 42 43 44 45 46 47 48 49 50 51 52 53 54 55 56 57 58 59 60 61 62 63 64 65 66 67 68 69 70 71 72 73 74 75 76 77 78 79 80 81 82 83 84 85 86 87 88 89 90 91 92 93 94 95 96 97 98 99 100 101 102 103 104 105 106 107 108 109 110 111 112 113 114 115 116 117 118 119 120 121 122 123 124 125 126 127 128 129 130 131 132 133 134 135 136 137 138 139 140 141 142 143 144 145 146 147 148 149 150 151 152 153 154 155 156 157 158 159 160 161 162 163 164 165 166 167 168 169 170 171 172 173 174 175 176 177 178 179 180 181 182 183 184 185 186 187 188 189 190 191 192 193 194 195 196 197 198 199 200 201 202 203 204 205 206 207 208 209 210 211 212 213 214 215 216 217 218 219 220 221 222 223 224 225 226 227 228 229 230 231 232 233 234 235 236 237 238 239 240 241 242 243 244 245 246 247 248 249 250 251 252 253 254 255 256 257 258 259 260 261 262 263 264 265 266 267 268 269 270 271 272 273 274 275 276 277 278 279 280 281 282 283 284 285 286 287 288 289 290 291 292 293 294 295 296 297 298 299 300 301 302 303 304 305 306 307 308 309 310 311 312 313 314 315 316 317 318 319 320 321 322 323 324 325 326 327 328 329 330 331 332 333 334 335 336 337 338 339 340 341 342 343 344 345 346 347 348 349 350 351 352 353 354 355 356 357 358 359 360 361 362 363 364 365 366 367 368 369 370 371 372 373 374 375 376 377 378 379 380 381 382 383 384 385 386 387 388 389 390 391 392 393 394 395 396 397 398 399 400 401 402 403 404 405 406 407 408 409 410 411 412 413 414 415 416 417 418 419 420 421 422 423 424 425 426 427 428 429 430 431 |
defparam drawonlastbaronly=true // The main goal of this indicator is to identify strengh and weekness in the distribution of volume per price // The main idea of the strategy behind is that the price will tend to reach a week point in the distribution repsectively either superior ("MinSup") or // inférior ("MinInf") if the price crosses over or under the strong volume level ("Max"). //VolumeByPrice HighLowBreakdown (mods by Kris75) //PRC_Bull&Bear Volume on Price | indicator //05.07.2018 //Nicolas @ www.prorealcode.com //Sharing ProRealTime knowledge ///////////////////// StartHighest = 0 StartLowest = 0 EndHighest = 0 EndLowest= 0 CustomEnd= 0 BreakDown= 0 //Fibonacci= 1 Invert= 0 DefaultLookBack= 200 NbOfBars= 50 // for the CustomEnd NbOfDiv= 12 // division of the range in x divisions/segments ScaleFactor= 1 // multiplier of volume for graphic needs if StartHighest then // if choice to start at the highest of the default lookback period StartVol=highest[DefaultLookBack](high) for j=DefaultLookBack downto 0 do if high[j]=StartVol then StartBar = j break endif next if EndLowest then // if choice to end at the lowest since the highest StartBar = max(1,StartBar) EndVol=lowest[StartBar](low) for k=StartBar downto 0 do if low[k]=EndVol then EndBar = k break endif next EndBar = max(1,EndBar) volsum = summation [StartBar](volume)-summation [EndBar](volume) // (total volumme from StartBar to 0) - (volume of the Endbar to 0) hh=highest[StartBar](high) ll=lowest[StartBar](low) div = (hh-ll)/NbOfDiv elsif CustomEnd then // if choice to have a specific End if NbOfBars < StartBar then StartBar = max(1,StartBar) EndBar = StartBar - NbOfBars EndBar = max(1,EndBar) volsum = summation [StartBar](volume)-summation [EndBar](volume) LowestLowSection = low[StartBar] for lls = StartBar downto Endbar if low[lls]<LowestLowSection then LowestLowSection = low[lls] endif next hh=highest[StartBar](high) ll=LowestLowSection div = (hh-ll)/NbOfDiv else EndBar = 0 // StartBar = max(1,StartBar) volsum = summation [StartBar](volume) hh=highest[StartBar](high) ll=lowest[StartBar](low) div = (hh-ll)/NbOfDiv endif else EndBar = 0 // StartBar = max(1,StartBar) volsum = summation [StartBar](volume) hh=highest[StartBar](high) ll=lowest[StartBar](low) div = (hh-ll)/NbOfDiv endif elsif StartLowest then // if choice to start at the lowest of the default lookback period StartVol=lowest[DefaultLookBack](low) for m=DefaultLookBack downto 0 do if low[m]=StartVol then StartBar = m drawtext("#StartBar#",barindex[m],high[m]) break endif next if EndHighest then StartBar = max(1,StartBar) EndVol=highest[StartBar](high) for n=StartBar downto 0 do if high[n]=EndVol then EndBar = n break endif next EndBar = max(1,EndBar) volsum = summation [StartBar](volume)-summation [EndBar](volume) hh=highest[StartBar](high) ll=lowest[StartBar](low) div = (hh-ll)/NbOfDiv elsif CustomEnd then if NbOfBars < StartBar then StartBar = max(1,StartBar) EndBar = StartBar - NbOfBars EndBar = max(1,EndBar) volsum = summation [StartBar](volume)-summation [EndBar](volume) HighestHighSection = high[StartBar] for hhs = StartBar downto Endbar do if high[hhs]>HighestHighSection then HighestHighSection = high[hhs] endif next hh=HighestHighSection ll=lowest[StartBar](low) div = (hh-ll)/NbOfDiv else EndBar = 0 // StartBar = max(1,StartBar) volsum = summation [StartBar](volume) hh=highest[StartBar](high) ll=lowest[StartBar](low) div = (hh-ll)/NbOfDiv endif else EndBar = 0 // StartBar = max(1,StartBar) volsum = summation [StartBar](volume) hh=highest[StartBar](high) ll=lowest[StartBar](low) div = (hh-ll)/NbOfDiv endif elsif CustomEnd then if NbOfBars < DefaultLookBack then StartBar = max(1,DefaultLookBack) EndBar = StartBar - NbOfBars EndBar = max(1,EndBar) volsum = summation [StartBar](volume)-summation [EndBar](volume) HighestHighSection = high[StartBar] for hhs = StartBar downto Endbar do if high[hhs]>HighestHighSection then HighestHighSection = high[hhs] endif next LowestLowSection = low[StartBar] for lls = StartBar downto Endbar if low[lls]<LowestLowSection then LowestLowSection = low[lls] endif next hh=HighestHighSection ll=LowestLowSection div = (hh-ll)/NbOfDiv else EndBar = 0 // StartBar = max(1,StartBar) volsum = summation [StartBar](volume) hh=highest[StartBar](high) ll=lowest[StartBar](low) div = (hh-ll)/NbOfDiv endif else StartBar = DefaultLookBack EndBar = 0 // if no choice of the highest / lowest => EndBar is 0 volsum = summation [DefaultLookBack](volume) hh=highest[StartBar](high) ll=lowest[StartBar](low) div = (hh-ll)/NbOfDiv endif drawvline(barindex[StartBar]) drawvline(barindex[Endbar]) StartBar = max(1,StartBar) Endbar = max(1,Endbar) i=0 StartbarIndex = barindex[StartBar] EndbarIndex = barindex[EndBar] //// creation of the variables identifying MinInf, MinSup and Max lrangeminInf = 0 hrangeminInf = 0 lrangeminSup = 0 hrangeminSup = 0 lrangemax = 0 hrangemax = 0 MaxVol = 0 NumBarVol = 0 NumBarMaxVol = 0 NumBarMinVolSup = 0 NumBarMinVolInf = 0 while i<NbOfDiv do lrange=ll+div*i hrange=lrange+div volbull=0 volbear=0 NumBarVol = i+1 for q = Endbar to StartBar do if close[q]>=lrange and close[q]<=hrange then if close[q]>open[q] then volbull=volbull+volume[q] else volbear=volbear+volume[q] endif endif next bullbar = round((volbull*StartBar)/volsum)*scalefactor bearbar = round((volbear*StartBar)/volsum)*scalefactor volbar = round(((volbear+volbull)*StartBar)/volsum)*scalefactor if i=0 then lrangemax = lrange hrangemax = hrange MaxVol = volbar NumBarMaxVol = NumBarVoL lrangeminSup = lrange hrangeminSup = hrange MinVolSup = VolBar NumBarMinVolSup = NumBarVol lrangeminInf = lrange hrangeminInf = hrange MinVolInf = VolBar NumBarMinVolInf = NumBarVol endif if volbar > MaxVol then lrangemax = lrange hrangemax = hrange MaxVol = volbar NumBarMaxVol = NumBarVol if MinVolSup < MinVolInf then lrangeminInf = lrangeminSup hrangeminInf = hrangeminSup MinVolInf = MinVolSup NumBarMinVolInf = NumBarMinVolSup endif lrangeminSup = lrange hrangeminSup = hrange MinVolSup = VolBar NumBarMinVolSup = NumBarVol elsif volbar < MaxVol then if volbar < MinVolSup then lrangeminSup = lrange hrangeminSup = hrange MinVolSup = VolBar NumBarMinVolSup = NumBarVol endif else lrangeminInf = lrangeminInf hrangeminInf = hrangeminInf MinVolInf = MinVolInf NumBarMinVolInf = NumBarMinVolInf endif if breakdown then drawrectangle(StartbarIndex,lrange,StartbarIndex+bullbar,hrange) coloured(46,139,87,255) drawrectangle(StartbarIndex,lrange,StartbarIndex+bearbar,hrange) coloured(255,0,0,255) if bullbar>bearbar then drawtext("■",StartbarIndex+bullbar,(lrange+hrange)/2,Dialog,Bold,22) coloured(46,139,87) else drawtext("■",StartbarIndex+bearbar,(lrange+hrange)/2,Dialog,Bold,22) coloured(255,0,0) endif drawvline(barindex[DefaultLookBack]) elsif not breakdown then drawrectangle(StartbarIndex,lrange,StartbarIndex+volbar,hrange) coloured(46,139,87,255) endif i=i+1 wend MaxVolumLevel = (lrangemax + hrangemax)/2 MinVolumSupLevel = (lrangeminSup + hrangeminSup)/2 MinVolumInfLevel = (lrangeminInf + hrangeminInf)/2 DRAWARROW (StartbarIndex, MaxVolumLevel) COLOURED (0, 255, 0) DRAWARROW (StartbarIndex, MinVolumSupLevel) COLOURED (255, 0, 0) DRAWARROW (StartbarIndex, MinVolumInfLevel) COLOURED (255, 0, 0) drawtext("#NumBarMaxVol#",StartbarIndex-3,MaxVolumLevel,Dialog,Bold,22) coloured(255,0,0) drawtext("#NumBarMinVolSup#",StartbarIndex-3,MinVolumSupLevel,Dialog,Bold,22) coloured(255,0,0) drawtext("#NumBarMinVolInf#",StartbarIndex-3,MinVolumInfLevel,Dialog,Bold,22) coloured(255,0,0) drawtext("MinInf #MinVolInf#",StartbarIndex+10,MinVolumInfLevel,Dialog,Bold,22) coloured(255,0,0) drawtext("MinSup #MinVolSup#",StartbarIndex+10,MinVolumSupLevel,Dialog,Bold,22) coloured(255,0,0) drawtext("Max #MaxVol#",StartbarIndex+10,MaxVolumLevel,Dialog,Bold,22) coloured(255,0,0) // Fibo StartFibo = max(1,StartbarIndex) EndFibo = max(1,EndbarIndex) isSwingDown = StartFibo < EndFibo if isSwingDown then fullrange = abs(hh-ll) fibo100 = hh fibo0 = ll fibo236 = ll+(fullrange*0.236) fibo382 = ll+(fullrange*0.382) fibo50 = ll+fullrange/2 fibo618 = ll+(fullrange*0.618) fibo764 = ll+(fullrange*0.764) r = 200 g = 0 b = 0 DrawText("HI #hh#",StartFibo,hh+fullrange*0.03,dialog,standard,10) coloured(r,g,b) // plot price at 0% and 100% levels DrawText("LO #ll#",EndFibo,ll-fullrange*0.03,dialog,standard,10) coloured(r,g,b) else fullrange = abs(hh-ll) fibo100 = ll fibo0 = hh fibo236 = hh-(fullrange*0.236) fibo382 = hh-(fullrange*0.382) fibo50 = hh-fullrange/2 fibo618 = hh-(fullrange*0.618) fibo764 = hh-(fullrange*0.764) r = 0 g = 200 b = 0 DrawText("HI #hh#",StartFibo,hh+fullrange*0.03,dialog,standard,10) coloured(r,g,b) // plot price at 0% and 100% levels DrawText("LO #ll#",EndFibo,ll-fullrange*0.03,dialog,standard,10) coloured(r,g,b) endif if invert = 0 then // plot fibonacci levels DrawSegment(barindex[StartBar],fibo0,barindex[EndBar],fibo0) coloured(r,g,b) DrawText("0%",barindex[EndBar]-3,fibo0*1.01,Dialog,Standard,11) coloured(r,g,b) DrawSegment(barindex[StartBar],fibo236,barindex[EndBar],fibo236) coloured(r,g,b) DrawText("23.6%",barindex[EndBar]-3,fibo236*1.01,Dialog,Standard,11) coloured(r,g,b) DrawSegment(barindex[StartBar],fibo382,barindex[EndBar],fibo382) coloured(r,g,b) DrawText("38.2%",barindex[EndBar]-3,fibo382*1.01,Dialog,Standard,11) coloured(r,g,b) DrawSegment(barindex[StartBar],fibo50,barindex[EndBar],fibo50) coloured(r,g,b) DrawText("50.0%",barindex[EndBar]-3,fibo50*1.01,Dialog,Standard,11) coloured(r,g,b) DrawSegment(barindex[StartBar],fibo618,barindex[EndBar],fibo618) coloured(r,g,b) DrawText("61.8%",barindex[EndBar]-3,fibo618*1.01,Dialog,Standard,11) coloured(r,g,b) DrawSegment(barindex[StartBar],fibo764,barindex[EndBar],fibo764) coloured(r,g,b) DrawText("76.4%",barindex[EndBar]-3,fibo764*1.01,Dialog,Standard,11) coloured(r,g,b) DrawSegment(barindex[StartBar],fibo100,barindex[EndBar],fibo100) coloured(r,g,b) DrawText("100%",barindex[EndBar]-3,fibo100*1.01,Dialog,Standard,11) coloured(r,g,b) elsif invert = 1 then // plot invert fibonacci levels DrawSegment(barindex[StartBar],fibo0,barindex[EndBar],fibo0) coloured(r,g,b) DrawText("100%",barindex[EndBar],fibo0,Dialog,Standard,11) coloured(r,g,b) DrawSegment(barindex[StartBar],fibo236,barindex[EndBar],fibo236) coloured(r,g,b) DrawText("76.4%",barindex[EndBar],fibo236,Dialog,Standard,11) coloured(r,g,b) DrawSegment(barindex[StartBar],fibo382,barindex[EndBar],fibo382) coloured(r,g,b) DrawText("61.8%",barindex[EndBar],fibo382,Dialog,Standard,11) coloured(r,g,b) DrawSegment(barindex[StartBar],fibo50,barindex[EndBar],fibo50) coloured(r,g,b) DrawText("50.0%",barindex[EndBar],fibo50,Dialog,Standard,11) coloured(r,g,b) DrawSegment(barindex[StartBar],fibo618,barindex[EndBar],fibo618) coloured(r,g,b) DrawText("38.2%",barindex[EndBar],fibo618,Dialog,Standard,11) coloured(r,g,b) DrawSegment(barindex[StartBar],fibo764,barindex[EndBar],fibo764) coloured(r,g,b) DrawText("23.6%",barindex[EndBar],fibo764,Dialog,Standard,11) coloured(r,g,b) DrawSegment(barindex[StartBar],fibo100,barindex[EndBar],fibo100) coloured(r,g,b) DrawText("0%",barindex[EndBar],fibo100,Dialog,Standard,11) coloured(r,g,b) endif return |
Share this
No information on this site is investment advice or a solicitation to buy or sell any financial instrument. Past performance is not indicative of future results. Trading may expose you to risk of loss greater than your deposits and is only suitable for experienced investors who have sufficient financial means to bear such risk.
ProRealTime ITF files and other attachments :
Find other exclusive trading pro-tools on ![]()
PRC is also on YouTube, subscribe to our channel for exclusive content and tutorials


Why does it plot on the bottom and does not show any data?
you should add the indicator on the price
Hi, can I add this indicator to the Chart with PRT 10.3 or just for ver. 11 beta ? Thanks
Upss I got it, 10.3 only with premium ,I can’t add it to the chart with Complete ver.
Add indicator on price doesnt require any specific type of subcription. Click on the wrench at the left upper side of the price chart, to add an indicator on the price.
bonjour j’ai une petite question comment peux on enlevé la bar blanche sur la bougie en cours
merci
Hi Kris, is there a way to increase the number of rows? I get a loop error