







ema-sma + Volume
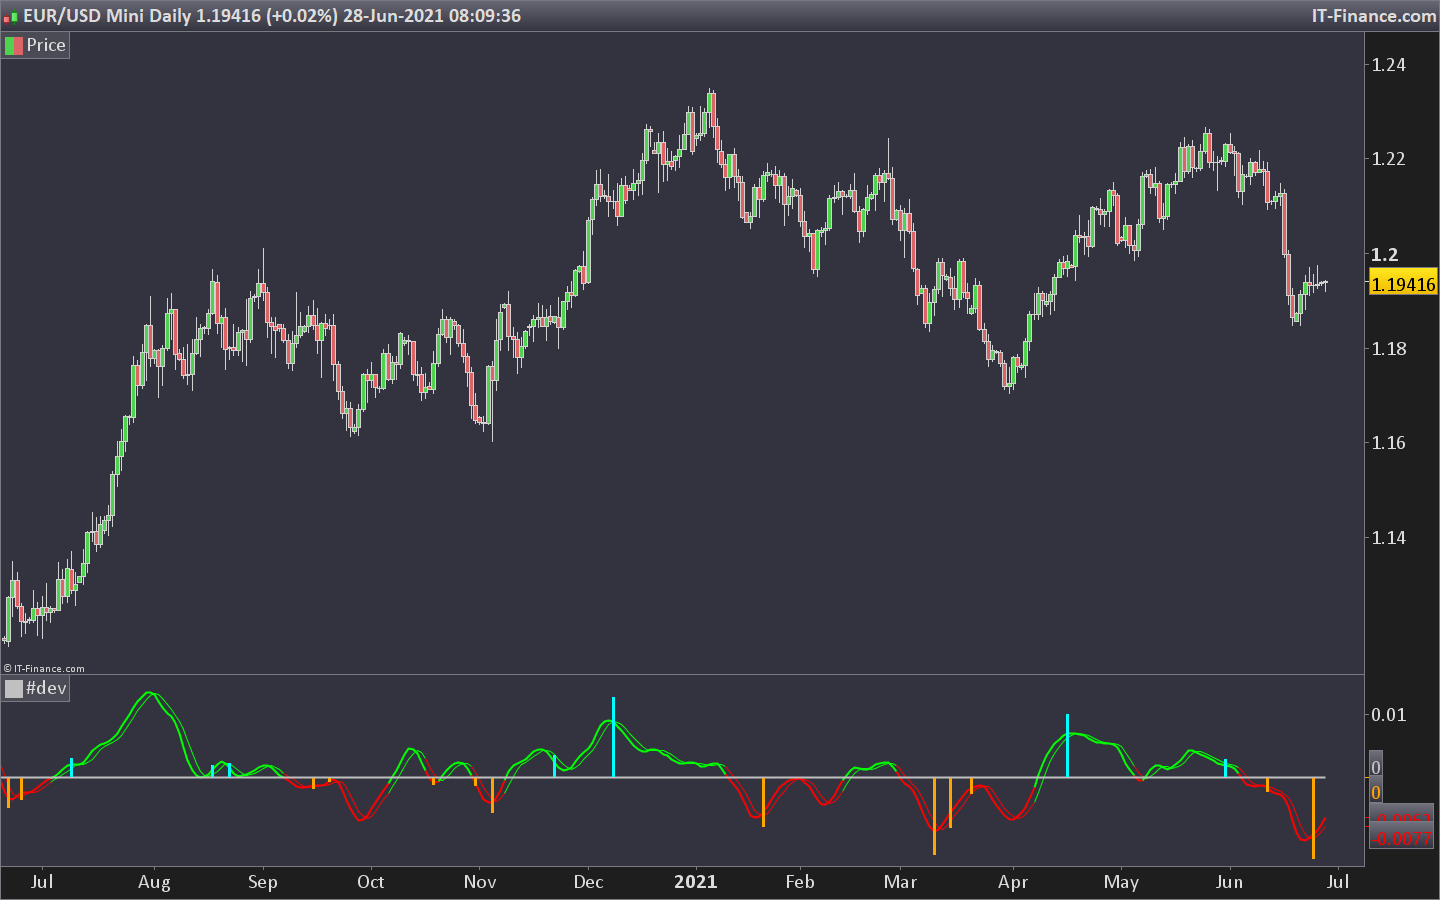
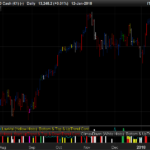
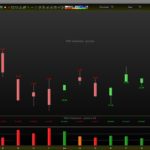
Oscillator from the difference between Ema and Sma around line 0, fairly reactive if you use the crossing of the 2 lines, more conservative if you expect the lines to cross the zero line. Histogram / column for the large change in volume with the cut so that it only shows a large divergence with the mean. colors show trends.
//PRC_ema-sma vol | indicator
//28.06.2021
//Nicolas @ www.prorealcode.com
//Sharing ProRealTime knowledge
//converted from pinescript

// --- settings
length = 9 //input(9, minval=1, title="short ema")
lensma = 17 //input(17, title="long sma")
// --- end of settings

vol = volume
src=close
vm = 100 * ((average[length](vol) - average[length](vol)[4]) / average[length](vol)[4])
vvm = 100 * average[3]((vm - vm[1]) / vm[1])
osc = average[3](exponentialaverage[length](src) - average[lensma](src))
sig = (osc + 2 * osc[1] + 2 * osc[2] + osc[3]) / 6
if osc>0 then
 r=0
 g=255
 else
 r=255
 g=0
endif
if abs(vvm / 8) > abs(average[5](vvm)) then
 cut=osc/.7
else
 cut=0
endif
if cut>0 then
 r1=0
 g1=255
 b1=255
else
 r1=255
 g1=165
 b1=0
endif
return sig coloured(r,g,0) as "Sig", osc coloured(r,g,0) style(line,2) as "ROC", 0 style(line,2) as "zero line", cut coloured(r1,g1,b1) style(histogram)
Comments
You must be logged in to post a comment.

Bonjour Nicolas, j'ai récemment découvert cet indicateur (Regularized Momentum 2017) et je le trouve très intéressant, mais je voulais vous demander, quelle ligne du code dois-je modifier pour que les résultats numériques des quatre lignes qui composent le graphique apparaissent avec plus de cinq décimales places, par exemple avec sept ( 0,00000012) Merci
Bonjour, nouveau sur PRT (qq jours), j'essaie un peu de voir quel type d'indicateur me conviendrait et je vais voir si celui-ci peut m'aider. Merci pour votre aide et vos nombreux posts très utiles pour les amateurs comme moi. Bien cordialement