Value Chart High/Low

Value Chart High/Low

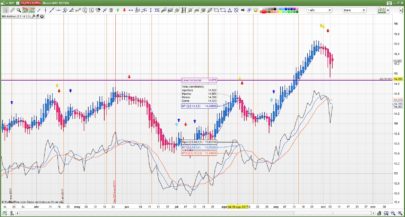
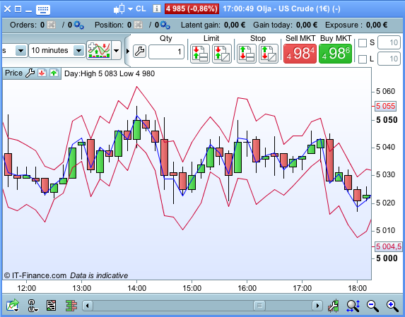
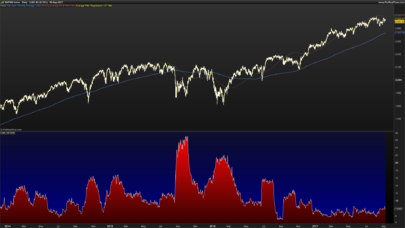
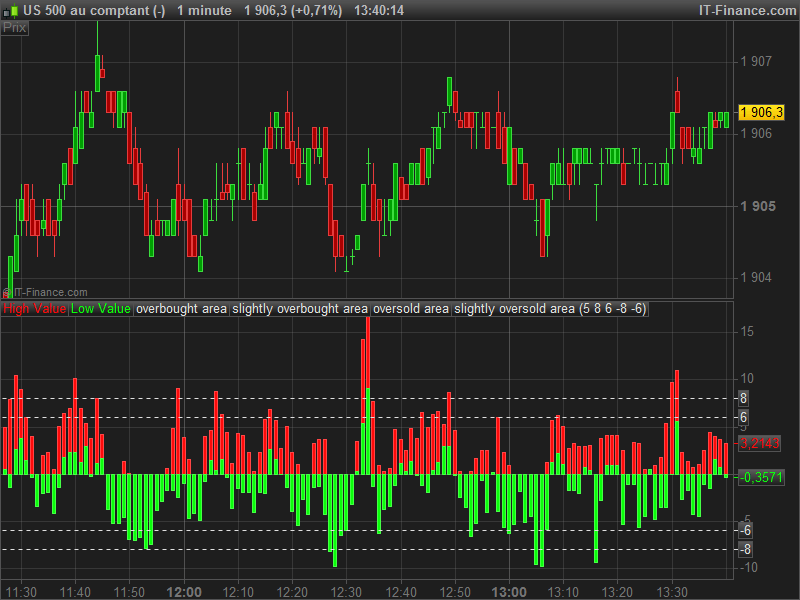
The original value chart is made of OHLC candlesticks drowned on a normalized scale. This one only reflect high and low values, that are more useful for its purpose.

This indicator is popular in scalping trading and short-term binary options because of its effectiveness to spot prices excess on a relative short time scale. Period and overbought/oversold areas are configurable to fit your timeframe and trading method.

Share this

Risk disclosure:

No information on this site is investment advice or a solicitation to buy or sell any financial instrument. Past performance is not indicative of future results. Trading may expose you to risk of loss greater than your deposits and is only suitable for experienced investors who have sufficient financial means to bear such risk.

ProRealTime ITF files and other attachments : How to import ITF files into ProRealTime platform?

PRC is also on YouTube, subscribe to our channel for exclusive content and tutorials
  1. Nicolas • 02/17/2016 #

    Very nice, thanks for your contribution. Next generation of the platform will have the ability to draw custom candlestick with only a simple instruction, then we’ll can make this indicator entirely without restriction. You can have a look on the new DRAWCANDLESTICK instruction here : http://www.prorealcode.com/documentation/drawcandle/
    Drawing Bar chart will be also possible with the instruction DRAWBARCHART  : http://www.prorealcode.com/documentation/drawbarchart/

    • daveAF • 02/17/2016 #

      very interesting, do you know when it will be available to everyone?

    • Nicolas • 02/17/2016 #

      Don’t really know it. I only have a VIP Beta access and it looks promising. A lot of improvements have been made for indicators development and beyond. Of course i’ll give news here in ProRealCode as soon as possible.
      I already have investigated in new drawing capabilities and it is awesome! At least, we can do almost anything for chart drawing. Our imagination the limit 🙂

    • daveAF • 02/17/2016 #

      Well, i’ll look forward for it. Cant wait.Thank you Nicolas!

  2. Nicolas • 02/17/2016 #

    For your interest i have coded the ProRealTime next generation version of this indicator, with all the OHLC value. I’m talking about it here in the forum : http://www.prorealcode.com/topic/the-next-prorealtime-version-10-3-and-new-graphical-functionnalities/#post-3316

  3. hans • 02/17/2016 #

    Salut Nicolas,
    for me the chart shows up as 2 lines. what does it mean “high value” and “low value”? is it enough for the “high value” to be oversold to trigger a signal or do both lines have to be above?
     
    Merci

    • Nicolas • 02/17/2016 #

      Only high for short signal and low for long signal are important.

  4. tfx • 02/17/2016 #

    Nice indicator. It might be a newbie question, but what kind of candlesticks are visible on the upper part of the chart? They are kind of equalized. Thank you.

    • daveAF • 02/17/2016 #

      Don’t remember but they seem to be normal candlesticks to me. In 1 minute time frame there not much ticks. 

  5. tfx • 02/17/2016 #

    This was my first thought, but 1 minute bars don’t look like these on my charts. Hmm…

    • daveAF • 02/17/2016 #

       It’s SP500 before Wall Street open. 

    • tfx • 02/17/2016 #

      I will be looking into it. Thank you for responding!

avatar
Register or

Likes

avatar avatar avatar avatar avatar avatar avatar avatar avatar avatar
Related users ' posts
rafadonl2 is not taken into account in the procedure. It considers only if it is a doji or when candle...
Guibourse Okay thanks, just a question : how do you plot your two lines in the same window as price ? ...
rafadonl2 sorry, I don't understand your question. Indicator draws Heikin Ashi candle, not price cand...
Nicolas
8 years ago
swapping Bonjour Nicolas, comment doit-on modifier le code (ou ajouter la variable "style") pour que ...
Nicolas Il faut changer la dernière ligne du code par : return ibuf108 style(line,2) as "Vostro", ...
swapping Merci beaucoup Nicolas, c'est mieux ainsi ...
flodefacebook Merci Nicolas pour cet indicateur. Très utile dans une technique de retournement.
HeikinAshi thank you for this very interesting indicator Nicolas! did you define a tradable setup fo...
mahdi how can I import itf file into mt4? please help
Nicolas That code is not for MT4, we do not offer free assistance for this platform, but you can ask...
guinsu2000 hello could you share your copy in a pdf or where you whant please ?
ERICM en copiant collant : erreur de syntaxe apparaît le popup demande de définir length1, length2...
Nicolas En téléchargeant le fichier itf et import dans la plateforme, vous n'aurez pas ces problèmes.
Bateson Bonjour Nicolas un grand merci pour ce travail que je souhaiterai faire évoluer. Je n'arrive...
gblast I added this indicator to my pro real time but its not showing up on my candles. Its invisible
BERTJES82 Hi Nicolas, is it possible to adjust the starting date of the VWAP on the charts? Thanks in ...
Nicolas Yes, have a look there: https://www.prorealcode.com/prorealtime-indicators/vwap-date-anchored/
Dadoo Merci Nicolas!
avatar
Anonymous Thanks for sharing! On the other hand can we remove the vertical gray lines?
ShaunG Appreciated! Thanks 100%
tonbijl good afternoon when i enter the code i get an error message Syntax error
Steven Bahia Hi Nicolas - great indicator - is there a way to place a alert when the Oscillator crosses ...
Nicolas Alerts can't be programmed, you have to set them yourself with the Alert tool of the platfor...
Steven Bahia just to add to this would there be a way to establish a entry price from the Oscillator
juanj Hi Nicolas, this is very interesting. Do you mind maybe providing some more information on h...
avatar
fabioerliam Hi Nicolas...I don't know where to post my request.....sorry!!!! Can you tell me in a gener...
Nicolas Hi, please post your question in the ProOrder section of the forum.
leonz007 Hi Despair, dont know why after import and add your indicator, it does not go on to the pric...
Nicolas Apply it on the price chart with the wrench at the left upper side of the price chart.
Sydneyhom Hi Despair Thanks for writing the code and for generously making it available to the public...
Nicolas Your PRT version is inferior to 10.3? So the code in its default state is not compatible. A ...
Mbulelo Hi Nicolas Hope all is well your side, do you have a specific strategy for the MFT Swing ...
Nicolas No I don't, try to make it on your own, or ask in forums (follow the posting rules please).
christophe11560 salut gabri, Je n'ai pas de commentaire sur "s*s", c'est ton choix personnel. Je me posais...
gabri Hi, the SQRT(254) it is used to annualize the value. In terms of the "s*s" I just used the s...
christophe11560 Merci pour ton retour
Khaled Thanks, but if I may ask what's EMA Period? The price which reverses the EMA[20] is not the ...
Francesco78 EMA is not a moving average, it is just the name we called the quantity defined above
Khaled My bad. Thank you so much!
Abz Thanks gabri
Mattzi In your opinion is less than 20 stocks a bad idea? Thank you.
gabri No, you can pick as many or as little as you want. The portfolio composition depends on many...
xel Hi! I found myself that the indicator posted here contain an error, I want to edit or fix i...
marinober Ciao. avrei necessità di usare questo indicatore in intraday . Dovrei poter dare un prezzo d...
Wing Not yet but I plan to.
Leo Have a look in this Forum, I got something interesting for you... https://www.prorealcode.co...
Dávid Gyalus Dear Wing, As I am a daytrader, and one of my best friend is a programmer we think your a...
Mr_Balagan Bonjour, j'ai quelques questions concernant cette combinaison d'indicateurs qui à l'air inté...
larouedegann STE : Fonction statistique "erreur standard" de séries temporelles de N périodes pour le pri...
Mr_Balagan Merci pour ces informations précieuses larouedegann. J'y vois plus clair. Encore joli boulot

Top