







Position sizing based on Yhang-Zhan variation of Garman-Klass volatility
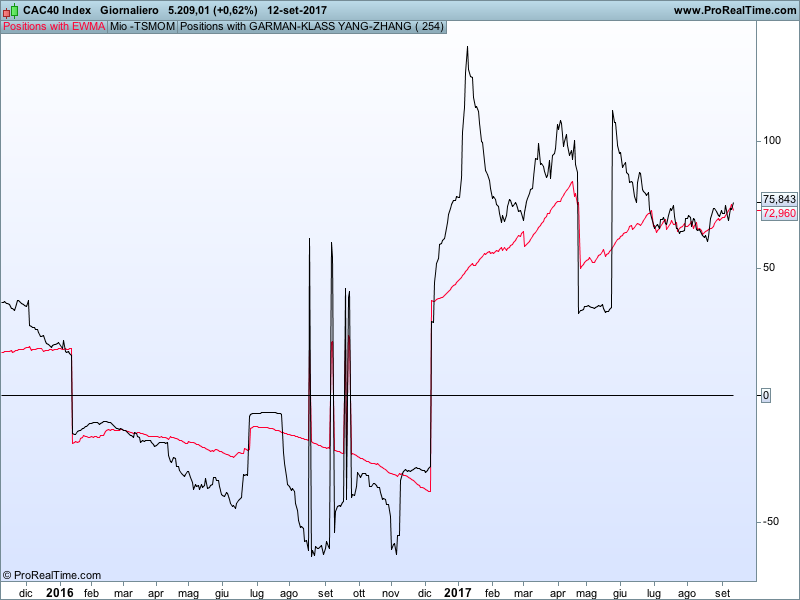
This code has to be used in conjunction with a screener, that I will post soon, in order to build a weighted portfolio based on volatility and momentum. You can choose to use the EWMA (Exponential Weighted Moving Average) or the most sophisticated Yang-Zhang variation of the Garman-Klass volatility to build your positioning. Just multiply the number the graph is showing for the basic import you are normally investing. Let’s say for example that you normally invest 1000 Euros per trade per stock and the code gives you the number 9 for stock A and 5 for stock B. You would want to buy 9000 stocks A and 5000 stocks B (or a different number but always weighted 9 to 5).
This positioning works excellent in portfolios with 20-30 stocks minimum.
Blue skies!!
//periodo=254

a=log(close/close[periodo])

//volatility with GARMAN-KLASS YANG-ZHANG
zz=call "mio - tsmom improved volat"[22]
vol=sgn(a)/zz
ret=log(close/close[1])
//l=60/61
l=0.983
cx=ret*ret
if barindex>2 then
 s2=l*s2[1]+(1-l)*cx[1]
endif

sann=(periodo*s2)


return SGN(a)*1/sann as "Positions with EWMA",0, vol as "Positions with GARMAN-KLASS YANG-ZHANG"
Comments
You must be logged in to post a comment.

ABZ, the 9 and 5 I was referring to are JUST EXAMPLES. You need to use this indicator when building portfolios in order to give a weight-based-on-volatility positioning to every stock. Let's use another example. Let's use ENEL, ENI,FCA as an example with yesterday close - 16th Sept 2017. We find that the YZidx (Yhang Zhan Index) for these titles are respectively 40.139 for ENEL, 65.129 for ENI and 6.10 for FCA. That means that you will have to buy more ENI than FCA. You can do that in a few ways. You can multiply these index for a minimum value - say 1000 Euros - and get 40.139x1000=40139 Euros of Enel, 65.129x1000=65129 Euros of ENI and 6.10x1000=6100 Euros of FCA. Or you can build the folio with [40.139/(40.139+65.129+6.10)]*100=36% stocks of ENEL, [65.129/(40.139+65.129+6.10)]*100=58,5% of ENI's stocks and with [6.1/(40.139+65.129+6.10)]*100=5.5% of FCA's stocks.

No, you can pick as many or as little as you want. The portfolio composition depends on many factors. I like to use more portfolios with a number of titles varying from 20 to 50 (it depends on the period)