Triple Raff Channel linear projection indicator for PRT.
Premise
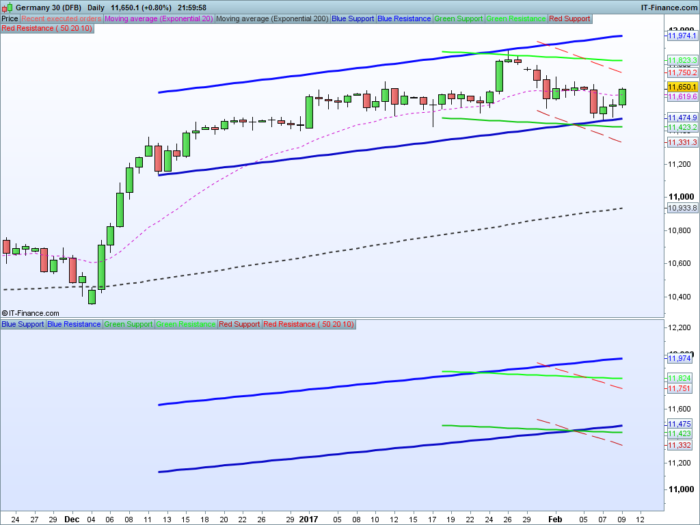
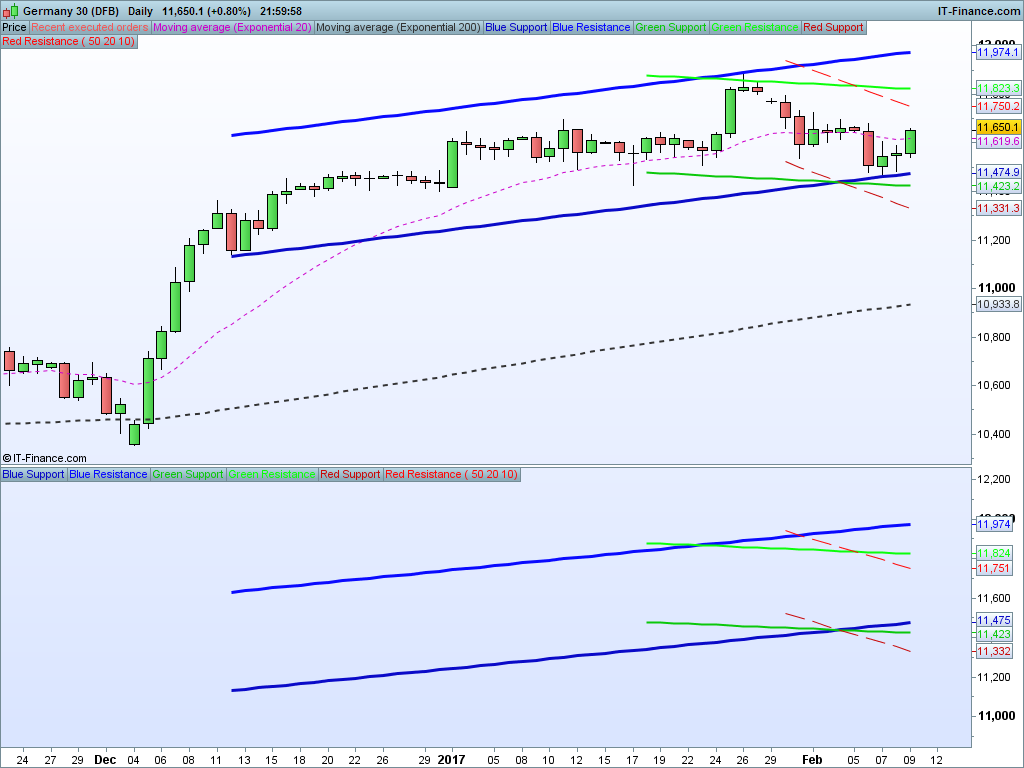
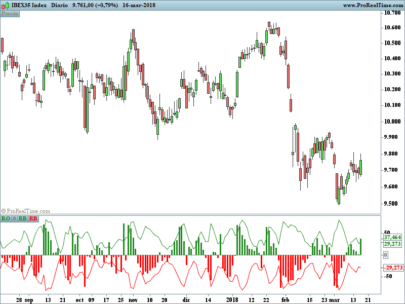
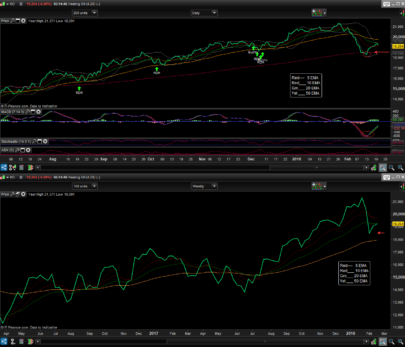
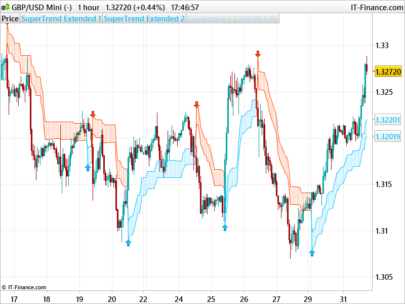
PRT implementation of the “Bianca” trends visualization of 3 linear regressions. This indicator adopts the Raff channel algorithm and outputs 3 sets of support and resistance lines on the same chart. These sets represent:
- Primary trend (blue)
- Secondary trend (green)
- Tertiary trend (red)
Interpretation:
If all three sets of trend-lines align, a strong sentiment is established. This could be bullish, bearish or consolidating.
If tertiary trend and/or secondary trend are diverging from primary trend, or diverging from each other, a breakout of the wider trend is more probable.
If you are not familiar with this concept and associated trading systems, read up on raf channels and/or bianca trends.
http://stockcharts.com/school/doku.php?id=chart_school:chart_analysis:raff_regression_chan
Variables
Defaults are 50 bars (primary); 20 (secondary); 10 (tertiary). These can be changed by you.
Developer Information
- The mid lines are not plotted but they are available of course. If you would like to view them or adapt further then use reg
- Support and resistance lines are averaged from raff and riff lines. If you want to see both, replace averaging code (source code is commented)
Enjoy!
Maz
— code —
|
1 2 3 4 5 6 7 8 9 10 11 12 13 14 15 16 17 18 19 20 21 22 23 24 25 26 27 28 29 30 31 32 33 34 35 36 37 38 39 40 41 42 43 44 45 46 47 48 49 50 51 52 53 54 55 56 57 58 59 60 61 62 63 64 65 66 67 68 69 70 71 72 73 74 75 76 77 78 79 80 81 82 83 84 85 86 87 88 89 90 91 92 93 94 95 96 97 98 99 100 101 102 103 104 105 106 107 108 109 110 111 112 113 114 115 116 117 118 119 120 121 122 123 124 125 126 127 128 129 130 131 132 133 134 135 136 137 138 139 140 141 142 143 144 145 146 147 148 149 150 151 152 153 154 155 156 157 158 159 160 161 162 163 164 165 166 167 168 169 170 171 172 173 174 175 176 177 178 179 180 181 182 183 184 185 186 187 188 189 190 191 192 193 194 195 196 197 198 199 200 201 |
// Triple RAF Channel (Bianca) indicator for PRT // Written by "Maz" at prorealcode.com // Adopted from RAFF algorithm // -- for i = 1 to 3 // Blue (Long term) if i = 1 then k = blue det = DPO[k*2](close) if det=det[1] and det[1]=det[2] and det[2]<>det[3] then flag = 1 endif n = (k*2)-4 p = (n/2)-1 d100 = DPO[n](close) moy100 = close-d100 co = (moy100-moy100[1]+(close[p])/n)*n h100 = dpo[n](high) moyh = high-h100 hi = (moyh-moyh[1]+(high[p])/n)*n l100 = dpo[n](low) moyl = low-l100 lo = (moyl-moyl[1]+(low[p])/n)*n if flag=1 and flag[1]=0 then somx = 0 somy = 0 somxx = 0 somxy = 0 for i=1 to k somx = somx+i next for i=0 to k-1 somy=somy+co[i] next for i=1 to k somxx=somxx+(i*i) next for i=0 to k-1 somxy=somxy+(co[i]*(k-i)) next a = (k*somxy-somx*somy)/(k*somxx-somx*somx) b = (somy-a*somx)/k for i=0 to k-1 ecah = hi[i]-a*(k-i)-b maxh = max(maxh,ecah) ecal = a*(k-i)+b-lo[i] maxl = max(maxl,ecal) next endif if flag=0 then reg = undefined else j = j + 1 reg = a * j + b endif raffBlue = max(maxh,maxl) rafflBlue = reg-raffBlue raffhBlue = reg+raffBlue riffBlue = min(maxh,maxl) riffhBlue = reg+riffBlue rifflBlue = reg-riffBlue // (optional) - let's take an average of the riff and raff BlueResistance = (raffhBlue + riffhBlue) / 2 BlueSupport = (rafflBlue + rifflBlue) / 2 elsif i = 2 then // Green (Medium term) k = green Gdet = DPO[k*2](close) if Gdet = Gdet[1] and Gdet[1] = Gdet[2] and Gdet[2] <> Gdet[3] then Gflag = 1 endif Gn = (k*2)-4 Gp = (Gn/2)-1 Gd100 = DPO[Gn](close) Gmoy100 = close-Gd100 Gco = (Gmoy100 - Gmoy100[1]+(close[Gp])/Gn)*Gn Gh100 = dpo[Gn](high) Gmoyh = high-Gh100 Ghi = (Gmoyh - Gmoyh[1]+(high[Gp])/Gn)*Gn Gl100 = dpo[Gn](low) Gmoyl = low-Gl100 Glo = (Gmoyl-Gmoyl[1]+(low[Gp])/Gn)*Gn if Gflag = 1 and Gflag[1] = 0 then Gsomx = 0 Gsomy = 0 Gsomxx = 0 Gsomxy = 0 for i = 1 to k Gsomx = Gsomx+i next for i = 0 to k-1 Gsomy=Gsomy+Gco[i] next for i = 1 to k Gsomxx=Gsomxx+(i*i) next for i = 0 to k-1 Gsomxy=Gsomxy+(Gco[i]*(k-i)) next Ga = (k*Gsomxy-Gsomx*Gsomy)/(k*Gsomxx-Gsomx*Gsomx) Gb = (Gsomy-Ga*Gsomx)/k for i=0 to k-1 Gecah = Ghi[i]-Ga*(k-i)-Gb Gmaxh = max(Gmaxh,Gecah) Gecal = Ga*(k-i)+Gb-Glo[i] Gmaxl = max(Gmaxl,Gecal) next endif if Gflag = 0 then Greg = undefined else Gj = Gj + 1 Greg = Ga * Gj + Gb endif raffGreen = max(Gmaxh,Gmaxl) rafflGreen = Greg-raffGreen raffhGreen = Greg+raffGreen riffGreen = min(Gmaxh,Gmaxl) riffhGreen = Greg+riffGreen rifflGreen = Greg-riffGreen // (optional) - let's take an average of the riff and raff GreenResistance = (raffhGreen + riffhGreen) / 2 GreenSupport = (rafflGreen + rifflGreen) / 2 elsif i = 3 then // Red (Short Term) k = red Rdet = DPO[k*2](close) if Rdet = Rdet[1] and Rdet[1] = Rdet[2] and Rdet[2] <> Rdet[3] then Rflag = 1 endif Rn = (k*2)-4 Rp = (Rn/2)-1 Rd100 = DPO[Rn](close) Rmoy100 = close-Rd100 Rco = (Rmoy100 - Rmoy100[1]+(close[Rp])/Rn)*Rn Rh100 = dpo[Rn](high) Rmoyh = high-Rh100 Rhi = (Rmoyh - Rmoyh[1]+(high[Rp])/Rn)*Rn Rl100 = dpo[Rn](low) Rmoyl = low-Rl100 Rlo = (Rmoyl-Rmoyl[1]+(low[Rp])/Rn)*Rn if Rflag = 1 and Rflag[1] = 0 then Rsomx = 0 Rsomy = 0 Rsomxx = 0 Rsomxy = 0 for i = 1 to k Rsomx = Rsomx+i next for i = 0 to k-1 Rsomy=Rsomy+Rco[i] next for i = 1 to k Rsomxx=Rsomxx+(i*i) next for i = 0 to k-1 Rsomxy=Rsomxy+(Rco[i]*(k-i)) next Ra = (k*Rsomxy-Rsomx*Rsomy)/(k*Rsomxx-Rsomx*Rsomx) Rb = (Rsomy-Ra*Rsomx)/k for i=0 to k-1 Recah = Rhi[i]-Ra*(k-i)-Rb Rmaxh = max(Rmaxh,Recah) Recal = Ra*(k-i)+Rb-Rlo[i] Rmaxl = max(Rmaxl,Recal) next endif if Rflag = 0 then Rreg = undefined else Rj = Rj + 1 Rreg = Ra * Rj + Rb endif raffRed = max(Rmaxh,Rmaxl) rafflRed = Rreg-raffRed raffhRed = Rreg+raffRed riffRed = min(Rmaxh,Rmaxl) riffhRed = Rreg+riffRed rifflRed = Rreg-riffRed // (optional) - let's take an average of the riff and raff RedResistance = (raffhRed + riffhRed) / 2 RedSupport = (rafflRed + rifflRed) / 2 endif next return BlueSupport coloured (10, 10, 200) as "Blue Support", BlueResistance coloured (10, 10, 255) as "Blue Resistance" , GreenSupport coloured (10, 200, 10) as "Green Support", GreenResistance coloured (10, 255, 10) as "Green Resistance", RedSupport coloured (200, 10, 10) as "Red Support", RedResistance coloured (255, 10, 10) as "Red Resistance" |
Share this
No information on this site is investment advice or a solicitation to buy or sell any financial instrument. Past performance is not indicative of future results. Trading may expose you to risk of loss greater than your deposits and is only suitable for experienced investors who have sufficient financial means to bear such risk.
ProRealTime ITF files and other attachments :
Find other exclusive trading pro-tools on ![]()
PRC is also on YouTube, subscribe to our channel for exclusive content and tutorials


blue = 50
green = 20
red = 10
than you
Is there an easy way get a value returned from the indicator that says if the blue channel is heading up or down ?
Hello,
How can i project it on the chart?
Now it is below amongst the other indicators..
Thankss:)
This is AWESOME!
Thank you Maz!!
You’re welcome, thanks
Does anyone know how to make the lines extended? Like having an option for right and left?
With PRT it’s not currently possible to extend lines into the future (right) via the scripting language
Hi Maz,
How could we translate this in a strategy?
fantastic job btw
it seems it’s not working anymore with prorealtime 11, anyone has the same problem?
hi there,
I just checked and I does not work for me anymore neither – unfortunately. would be great if somebody could point to the right direction how to adjust the code.
Would be great if the code could be adjusted to work as a screener as well – as shephinc mentioned.
thanks
Hi,
Can you make an update for PRT v11 ?
Best Regards,
PLEASE, PLEASE someone modify the code of this special indicator for V 11.
Thank you in keen anticipation
just use 3 times a linear regression channel code you will find in the library.
Hi all, firstly happy to know that this is helping you. I look into updating it for PRT11 when I get the chance. All the best
Here’s the link to alternative linear regression channel indicator Nicolas is referring to that works on v12 since v10.3 being discontinued if anyone struggling to find it.
https://www.prorealcode.com/prorealtime-indicators/standard-deviation-standard-error-linear-regression-channel/