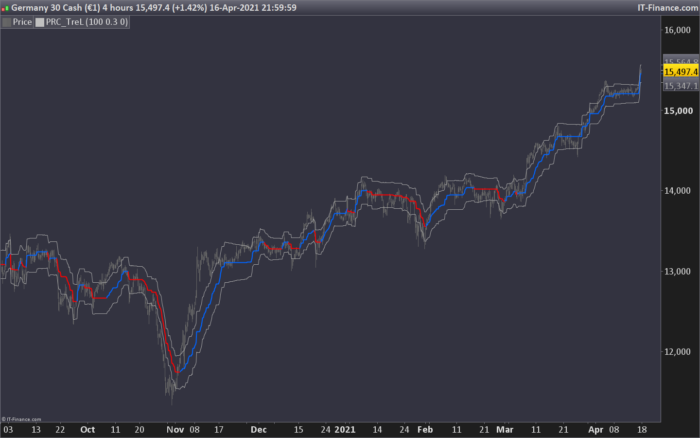
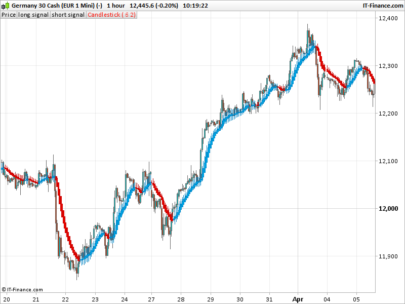
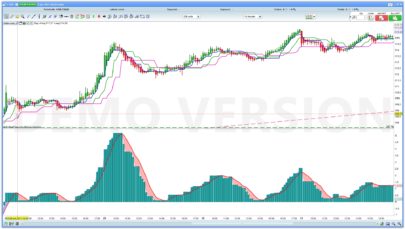
This indicator based on linear regression trend.
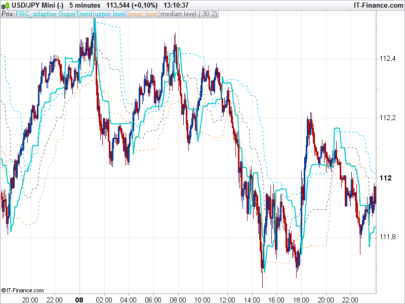
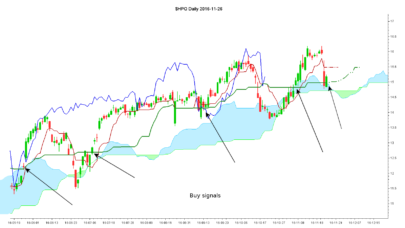
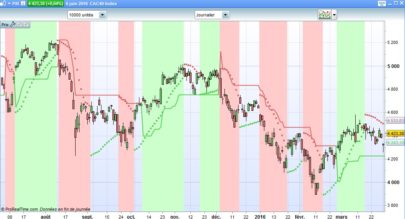
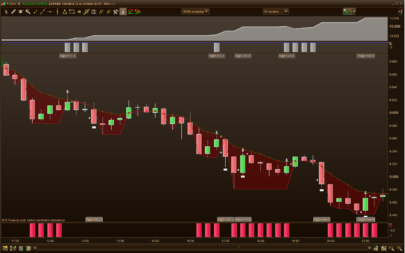
Blue line is a positive trend or buy/bullish trend. Red line trend is a negative trend or sell/bearish trend.
Upper and lower channel lines (in grey color) can be used as trailing stop or possible rebound of the price (revert to the mean).
Very simple and effective way to use linear regression in a different approach.
Converted from pinescript version as requested in this topic: https://www.prorealcode.com/topic/conversion-of-a-linear-regression-trend-indicator/
(all credits go to original author).
|
1 2 3 4 5 6 7 8 9 10 11 12 13 14 15 16 17 18 19 20 21 22 23 24 25 26 27 28 29 30 31 32 33 34 35 36 37 38 39 40 41 42 43 44 45 46 47 48 49 50 51 52 53 54 55 56 57 58 59 60 61 62 63 64 65 66 67 68 69 70 71 72 73 74 75 76 77 78 79 80 81 82 83 84 85 86 87 88 89 90 91 92 93 94 95 96 97 98 99 100 101 102 103 104 105 106 107 108 109 110 111 112 113 114 115 116 117 118 119 120 121 122 123 124 |
//PRC_TreL | indicator //18.04.2021 //Nicolas @ www.prorealcode.com //Sharing ProRealTime knowledge //converted from pinescript // --- settings len = 100 off= 0 dev= 2 //Deviation (minval=0.01) // --- end of settings once length=100 if barindex>len then c = close cp = c lreg = linearregression[len](close)[off] lregx = linearregression[len](close)[off+1] b = barindex s = lreg - lregx intr = lreg - b*s dS = 0.0 for i=0 to len-1 do dS= dS + square(cp[i]-(s*(b-i)+intr)) de = sqrt(dS/(len)) up = (-de*dev) + c dn= (de*dev) + c next c5=(high+low)/2 // factor = 0.001 hb = 0.00 hb = (hb[1]) hl = 0.000 hl = (hl[1]) lb = 0.00 lb = (lb[1]) l1 = 0.000 l1 = (l1[1]) c2 = 0 c2 = (c2[1]) + 1 trend = 0 trend = (trend[1]) n = dn x = up if barindex=0 then c2 = 0 lb = n hb = x l1 = c5 hl = c5 //hl if c2 = 1 then if x >= hb[1] then hb = x hl = c5 trend = 1 //trend else lb = n l1 = c5 trend = -1 //trend endif endif endif if c > 1 then if trend[1] > 0 then hl = max(hl[1], c5) if x >= hb[1] then hb = x //hb else if n < hb[1] - hb[1] * factor then lb = n l1 = c5 trend = -1 //trend endif endif else l1 = min(l1[1], c5 ) if n <= lb[1] then lb = n //lb else if x > lb[1] + lb[1] * factor then hb = x hl = c5 trend = 1 //trend endif endif endif endif if trend = 1 then v = hb r=0 g=100 b=255 else v = lb r=255 g=0 b=0 endif band = average[length](AverageTrueRange[1](close))*2 endif return v coloured(r,g,b) style(line,2), v+band coloured(168,168,168), v-band coloured(168,168,168) |
Share this
No information on this site is investment advice or a solicitation to buy or sell any financial instrument. Past performance is not indicative of future results. Trading may expose you to risk of loss greater than your deposits and is only suitable for experienced investors who have sufficient financial means to bear such risk.
ProRealTime ITF files and other attachments :
Find other exclusive trading pro-tools on ![]()
PRC is also on YouTube, subscribe to our channel for exclusive content and tutorials


Hi Nicolas thanks … I’m new to programming I would like to use it with blue +1 and red -1 graph to try to code it for a strategy.
Thank you
I deleted this part.
band = average [length] (AverageTrueRange [1] (close)) * 2
endif
Unfortunately I am unable to attach an image
change the last line with: return v coloured(r,g,b) style(line,2), v+band coloured(168,168,168), v-band coloured(168,168,168), r
and test if “r” is superior to 0, if it is the case, then the line is red and therefore the trend bearish.
Thanks … works as i wanted.
Bonjour Nicolas, comme Paolo.B je souhaiterais utiliser cette indicateur au sein d’un code. Après avoir copier/coller le code ci dessus j’ai rajouté ceci:
// Conditions pour ouvrir une position acheteuse
if not onmarket and b=255 then
BUY 1 CONTRACTS AT MARKET
endif
// Conditions pour fermer une position acheteuse
if longonmarket and b=0 then
SELL AT MARKET
ENDIF
Malheureusement les positions acheteuses sont beaucoup peu nombreuses et ne suivent pas du tout le fait d’acheter à chaque fois que la courbe est bleue.
Un conseil pour finir le code correctement?
Merci d’avance.
Hi Paolo.B, I have some difficulties to do as you. It seems that works for you, could you share your code to compare coding?
Thank you in advance.