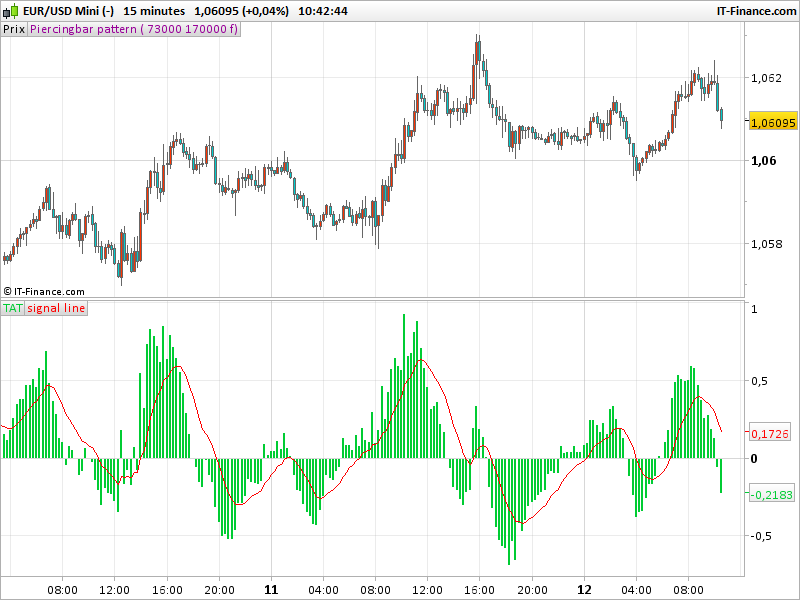
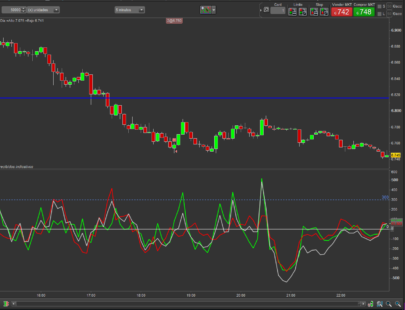
This TAT indicator combines the MACD and the Parabolic SAR and is to be considered as a trend indicator.
A study using the MACD and parabolic SAR revealed that it was interesting to link this with a certain calculation and weighting.
If the TAT indicator upward cuts through its signal line, the trend is upwards. If the TAT indicator crosses the signal line downwards, the trend is negative.
Coded by a request on english forum (link in the indicator code).
Original idea developed by Gerrit Bosboom.
|
1 2 3 4 5 6 7 8 9 10 11 12 13 14 15 16 17 18 19 20 21 22 23 24 25 26 27 28 29 30 31 32 33 34 35 36 37 38 39 40 41 42 43 44 45 46 47 48 49 50 51 52 53 54 55 56 57 58 59 60 61 62 63 64 65 66 67 68 |
//PRC_TAT | indicator //12.04.2017 //Nicolas @ www.prorealcode.com //Sharing ProRealTime knowledge //https://www.prorealcode.com/topic/tat-indicator/ //--- settings MACDFastPeriod=12 MACDSlowPeriod=26 MACDSignalPeriod=9 SARStep=0.02 SARMaximum=0.2 TATMACDMultiplier=66.67 TATSARMultiplier=6.67 TATSignalPeriod=12 // --- end of settings islong = 1 af = SARStep extreme = Max(close, close[1]) sn = Min(close, close[1]) sarr = sn sn = sn + af * (extreme - sn) if islong then if (low[1] < sn) then islong = 0//false; af = sarstep sn = extreme extreme = low[1] else if (extreme < high[1]) then extreme = high[1] af = af + sarstep if (af > sarmaximum) then af = sarmaximum endif endif if (high[1] > sn) then islong = 1//true; af = sarstep sn = extreme extreme = high[1] else if (extreme > low[1]) then extreme = low[1] af = af + sarstep if (af > sarmaximum) then af = sarmaximum endif endif sarr = sn endif endif endif tatsar = 0 tatmacd = 0 macdmain=macdline[MACDFastPeriod,MACDSlowPeriod,MACDSignalPeriod] macdsig=exponentialaverage[MACDSignalPeriod](macdmain) if sarr <> 0 then tatsar = (close - sarr) / sarr if close <> 0 then tatmacd = (macdmain - macdsig)/ close tatmain = 50*(tatsar * tatsarmultiplier + tatmacd * tatmacdmultiplier) endif signal=ExponentialAverage[tatsignalperiod](tatmain) endif return tatmain style(histogram) as "TAT", signal style(line) as "signal line" |
Share this
No information on this site is investment advice or a solicitation to buy or sell any financial instrument. Past performance is not indicative of future results. Trading may expose you to risk of loss greater than your deposits and is only suitable for experienced investors who have sufficient financial means to bear such risk.
ProRealTime ITF files and other attachments :
Find other exclusive trading pro-tools on ![]()
PRC is also on YouTube, subscribe to our channel for exclusive content and tutorials


Hi All! Would it be possible to have the same indicator with the MACD calculated with the DEMA average instead of the usual exponential average? Thanks a lot!
Why not, but do you think it would make such a noticeable difference?
Good question Nicolas! That’s why I was curious to check it! MACD based on DEMA is usually much faster than standard MACD. However if you think is worthless I trust you. You have much more experience than me for sure! 🙂