







4CMACDSqueeze
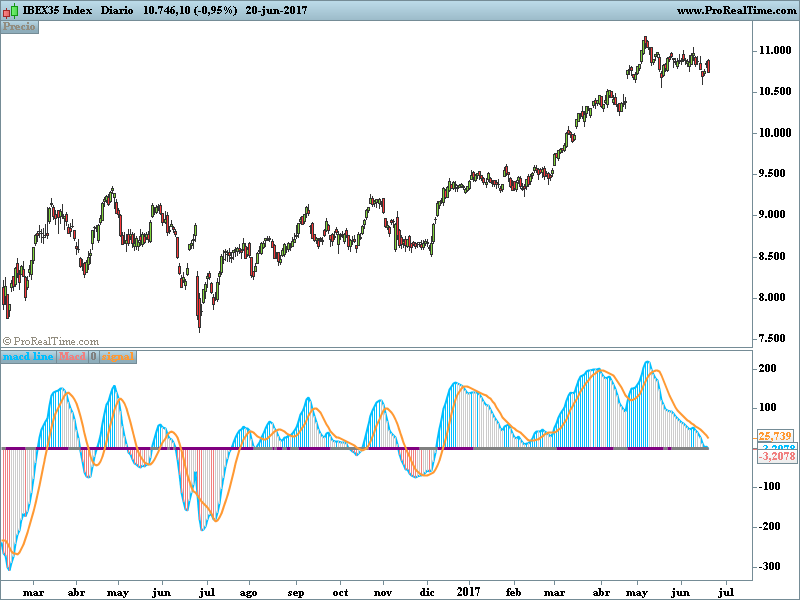
Prorealtime adaptation of the indicator code 4CMACDSqueeze appeared on the Tradinview platform.
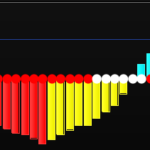
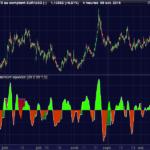
The 4CMACDSqueeze is a macd which has been added a squeeze derived from John Carter’s TTM Squeeze, an indicator of volatility appeared in his book “Mastering the Trade”.
The central zero line of the indicator created with a Bollinger Bands and a Keltner channel alerts us to the color change of market volatility.
In gray: low volatility
In purple: increased volatility
Adaptación para Prorealtime del código del indicador 4CMACDSqueeze aparecido en la plataforma Tradinview.
El 4CMACDSqueeze es un macd al que se le ha añadido un squeeze derivado del TTM Squeeze de John Carter , un indicador de volatilidad aparecido en su libro “Mastering the Trade”.
La linea central cero del indicador creada con unas Bandas Bollinguer y un canal Keltner nos avisa al cambio de color de la volatilidad del mercado.
En gris : baja volatilidad
en púrpura : aumento de volatilidad.
REM 4CMACDSqueeze
//@version=3
//study("4CMACDSqueeze"
// por edin228 para la plataforma Tradingview
//adaptación para Prorealtime

//===============macd================//
source = close

fastLength = 12
slowLength=26
signalLength=9

fastMA =ExponentialAverage[fastLength](source)
slowMA =ExponentialAverage[slowLength](source)

macdd = fastMA - slowMA
signal =Average [signalLength](macdd)

outMacD = macdd
outSignal = signal

//=========================4CHistogram===================//
//currMacd = MACD[fastLength,slowLength,9](close[0])
//prevMacd = MACD[fastLength,slowLength,9](close[1])

if outMACD <0 then
 if outMACD <outMACD[1] then
  r = 240
  g = 128
  b = 128
 else
  r=204
  g=204
  b=204
 endif
elsif outMACD >0 then
 if outMACD >outMACD[1] then
  r=0
  g=191
  b=255
 else
  r=204
  g=204
  b=204
 endif
endif


//========================Squeeze==================//

length = 20 //title="Bollinger Band Length"

lengthKC=20 //title="Keltner Channel Length"
multKC =1.5 //title="KC Deviations"

//useTrueRange =true title="Use TrueRange (KC)", type=bool)

// Calculate BB
basis =Average [length](source)
dev = multKC *STD[length](source)
upperBB = basis + dev
lowerBB = basis - dev

// Calculate KC
ma = Average [lengthKC](source)
rango=useTrueRange
if rango = useTrueRange then
 useTrueRange=TR(close)
else
 useTrueRange=(high - low)
endif
rangema =Average[lengthKC](rango)
upperKC = ma + rangema * multKC
lowerKC = ma - rangema * multKC

sqzOn  = (lowerBB > lowerKC) and (upperBB < upperKC)
sqzOff = (lowerBB < lowerKC) and (upperBB > upperKC)
noSqz  = sqzOn  and sqzOff

val =LinearRegression(source) - (highest[lengthKC]( high)and lowest[lengthKC] (low))and Average [lengthKC](close) and lengthKC and 0

if  noSqz then
 sr=128
 sg=128
 sb=128
elsif  sqzOn then
 sr=128
 sg=128
 sb=128
else
 sr=128
 sg=0
 sb=128
endif


return outmacd coloured (0,191,255)style(line,2)as "macd line",outmacd coloured(r,g,b)style (histogram,1)as "Macd", val coloured (sr,sg,sb)style(line,3) as "0",outsignal coloured(255,153,51)style (line,2)as "signal"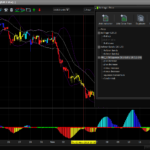

Comments
You must be logged in to post a comment.

Hi there, I downloaded the Indicator but the indicator does not show up on my charts. Am I doing something incorrectly. Regards JAe

Thanks for this indicator. Working on a 3 M timeframe with the DJI, it can produce some interesting results and if I have the patience and sufficient liquidity, it can produce some useful returns even on a 1 hour timeframe; however as a ‘belt and braces’ safeguard, I also use a crossover with 3 and 12 EMA in the price line because that crossover usually indicates change of direction that is subsequently confirmed by the 4CMACDsqueeze indicator. One little request, to improve clarity, can I change the colour and thickness of the MACD and Signal line; the current blue and gold colours as in use at present are a little faint against some backgrounds.
Hi, Worked it out. Thanks