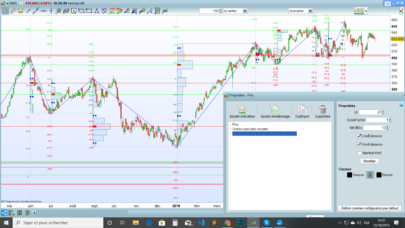
Following the principles of Holey, Wyckoff, Livermore, Tom Williams, and Anna Coulling among others.
We have related the main ones:
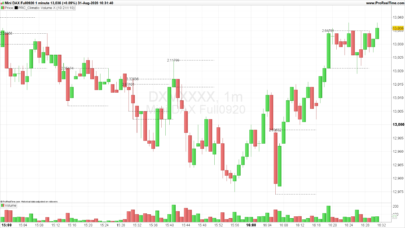
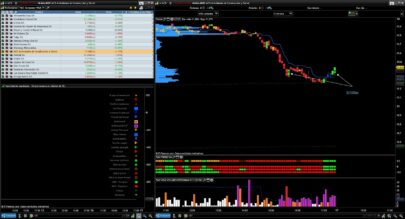
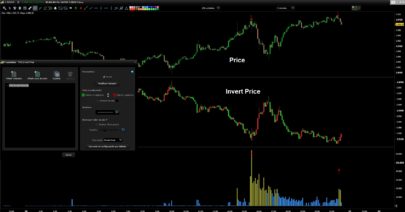
▴Candle / Bullish Bar //green triangle
▾ Candle / Bearish Bar //red triangle
- Sign indicating an anomaly between price and volume where a turn can be made in any direction by indecision. //circle
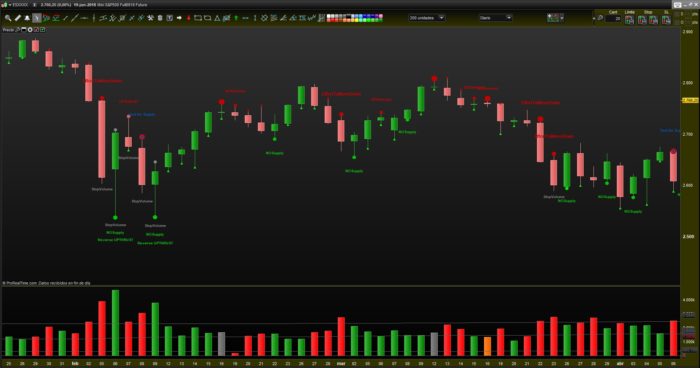
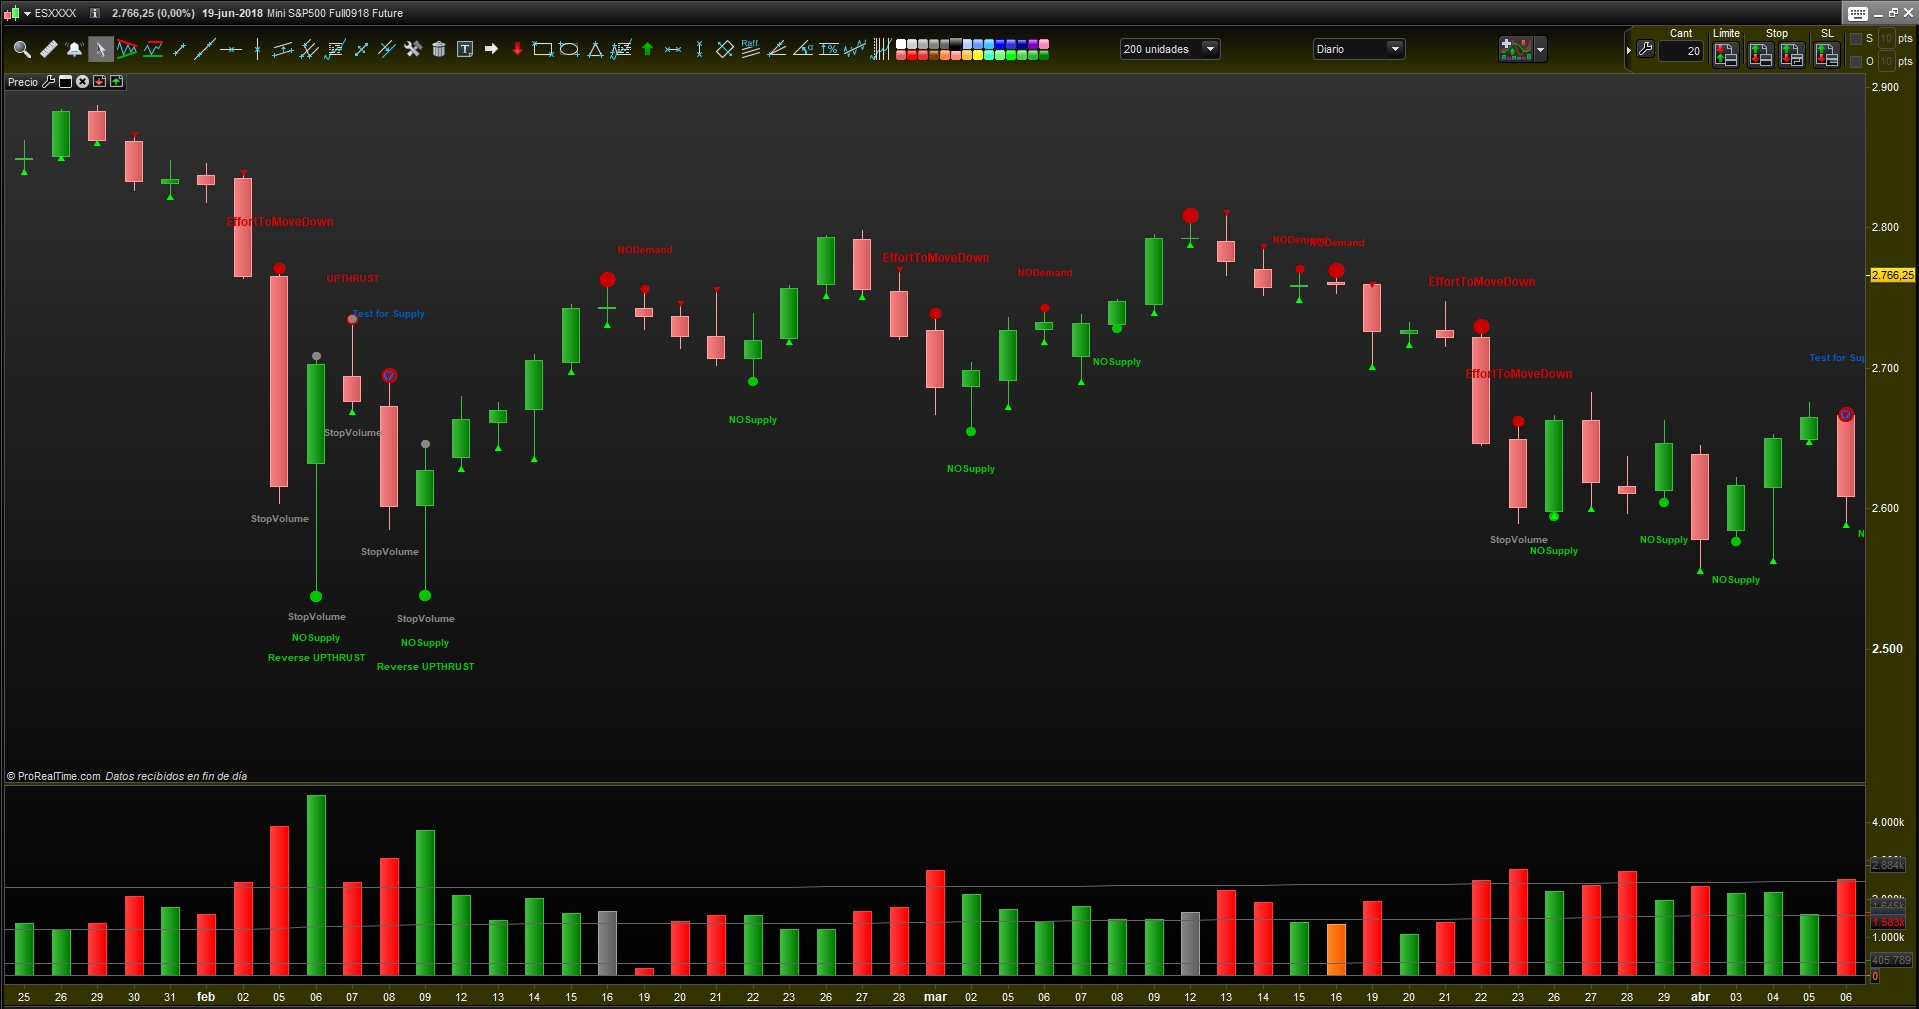
- NODemand //red circle
-In this situation professionals will not sustain the market if they observe weakness in the background.
-If the volume is low in bullish days, this shows no demand for the big ones.
-NO DEMAND BAR: narrow range bar, low volume, close in half or in the lower part..
- NOSupply //green circle
At the end of a bearish trend or bullish turn within the bearish trend, we will see an increase in hammer or candle candles with large shadows below that indicate demand pressure.
- Test for Supply / Test Volume //blue circle
Bearish bars: If the price falls with volume lower than the two previous bars, with narrow range, and the current candle that marks the price closes in half or higher, indicates “NOSupply”.
- StopVolume //gray circle
It shows the moment when purchases cover all sales.
-A high volume, bearish bar, wide range, will normally indicate sales, but …
-If the next day is bullish and close at maximum, this shows that the purchases absorbed the sales the previous day.
– Only professional money can do this and it is a good indicator of strength.
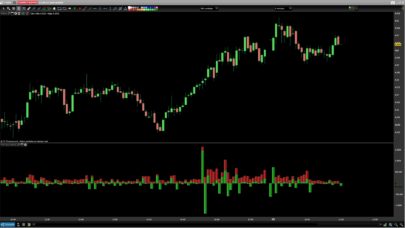
EFFORT:
- UP //green circle
- DOW //red circle
- UPTHRUST //red circle
- REVERSE UPTHRUST //green circle
|
1 2 3 4 5 6 7 8 9 10 11 12 13 14 15 16 17 18 19 20 21 22 23 24 25 26 27 28 29 30 31 32 33 34 35 36 37 38 39 40 41 42 43 44 45 46 47 48 49 50 51 52 53 54 55 56 57 58 59 60 61 62 63 64 65 66 67 68 69 70 71 72 73 74 75 76 77 78 79 80 81 82 83 84 85 86 87 88 89 90 91 92 93 94 95 96 97 98 99 100 101 102 103 104 105 106 107 108 109 110 111 112 113 114 115 116 117 118 119 120 121 122 123 124 125 126 127 128 129 |
//////////////////////////////////////////////////////////////////////// REM VSA Volume REM TAC VSA | indicator REM 09.06.2018 REM RB @ www.tiburonesdealetacorta.com REM Sharing www.tiburonesdealetacorta.com vol=volume atr = averagetruerange[10](close)*0.5 mm= average[100](volume) VolumeMA = Average[50](mm) Vlow = (VolumeMA - ((VolumeMA * 75) / 100)) VolumeMAA = Average[85](mm) Vhigh = (VolumeMAA + ((VolumeMAA * 85) / 100)) SPREADHL = (High[0]-Low[0])/2 AvgSpread= Average[50](SPREADHL) SPREAD1 = High -low/2 Spread2= Abs(High[0]-Low[0]) WIDE= (SPREAD1[0] > Spread2[1]*1.8) NARROWS= SPREADHL[0] < AvgSpread[1]*0.8 MIDCLOSE = (open+close)/2 UPBAR =(close[0] >= open[0]) // barra alcista DOWNBAR =(close[0] <= open[0]) // barra bajista DOWNCLOSE=(Close[1]<=(((High[0]-Low[0])*0.3)+Low[1])) UPCLOSE = (Close[1]>=(High[0]-((High[0]-Low[1])*0.3))) UP=max(UPCLOSE, UPBAR) Down= min(DOWNBAR, DOWNCLOSE) //Move Price if UP then DrawText("▴",barindex,low,SansSerif,bold,15)coloured(0,255,0) endif if Down then DrawText("▾",barindex,high,SansSerif,bold,15)coloured(200,0,0) endif //Divergence ---- anomaly Price & Volume ND1=(abs(open - close) <= (high - low) * 5/100) and vol > mm and up ND2=open[1] < close and vol < vol[1] and close[1]< close and DOWNBAR ND3=WIDE and vol > vhigh[1] and DOWNclose and Close[2]>Close[3] and High[1]>High[2] ND= ND1 or ND2 or ND3 if ND then DrawText("●",barindex,High,SansSerif,bold,20)coloured(200,0,0) endif //NoDemand ND1= Vol[1] < vol[2] and UPCLOSE and DOWNBAR and (abs(open - close) <= (high - low)/2 ) ND2 = volume < Vlow and Vol[0]<Vol[1] ND3 =(open[1] > close[1] and close > open and close <= open[1] and close[1] <= open and close - open < open[1] - close[1] ) and (abs(open - close) <= (high - low) * 5/100) and Vol[1]<Vol[2] ND4=(Close[1] > Close[2] and Close[1] < MIDCLOSE and narrows and Vol[1] < vol[2] and Vol[2] < vol[3]) NoDemand = ND1 or ND2 or ND3 or ND4 if NoDemand then DrawText("NODemand",barindex,high+atr*1,SansSerif,bold,10)coloured(200,0,0) DrawText("●",barindex,high,SansSerif,bold,10)coloured(200,0,0) endif //Stopping Volume STPV1= Vol[0] > Vhigh[1] and Vol[1] > Vhigh[2] StoppingVolume = STPV1 if StoppingVolume then DrawText("StopVolume",barindex,low-atr*0.5,SansSerif,bold,10)coloured(135,135,135) DrawText("●",barindex,high,SansSerif,bold,10)coloured(135,135,135) endif NSP1= (Close[1] < Close[2] and Close[1] < MIDCLOSE and wide and Vol[1] > Vhigh[2]) NSP2=(Close[1] < Close[2] and Close[1] < MIDCLOSE and wide and Volume[1]>Volume[2]) //NO Supply NOSupply = NSP1 or NSP2 if NOSupply then DrawText("NOSupply",barindex,low-atr*1,SansSerif,bold,10)coloured(0,200,0) DrawText("●",barindex,low,SansSerif,bold,12)coloured(0,200,0) endif TESNSP1=(Close[1] < Close[2] and Close[1] > UP and Vol[1] < Vol[2] and Vol[0] < vlow[1]) TESNSP2 = wide and DOWN and Vol > Vhigh[1] and vol[2] > vol[3] and Close[2]>Close[3] and High[1]>High[2] TESNSP3= wide and UP and Vol > Vhigh[1] and vol[2] > vol[3] and Close[2]<Close[3] and low[1]<low[2] //Test for Supply TESNSP = TESNSP1 or TESNSP2 or TESNSP3 and UPTHRUST if TESNSP then DrawText("Test for Supply",barindex,high+atr*1.4,SansSerif,bold,10)coloured(0,90,190) DrawText("●",barindex,high,SansSerif,bold,12)coloured(0,90,190) endif //"Reverse UPTHRUST" RUT1= (Close[1] < Close[2] and Close[1] < MIDCLOSE and wide and vol > vhigh[1] and vol[1] > vhigh[2] ) ReverseUPTHRUST = RUT1 if ReverseUPTHRUST then DrawText("Reverse UPTHRUST",barindex,low-atr*1.5,SansSerif,bold,10)coloured(0,200,0) DrawText("●",barindex,low,SansSerif,bold,15)coloured(0,200,0) endif //UPTHRUST UT1 =(Close[1] > Close[2] and Close[1] > MIDCLOSE and Low[1] < Low[2] and Low[2] < Low[3] and wide and Vol[1] > vol[2]) UPTHRUST= UT1 if UPTHRUST then DrawText("UPTHRUST",barindex,high+atr*1,SansSerif,bold,10)coloured(200,0,0) DrawText("●",barindex,high,SansSerif,bold,15)coloured(200,0,0) endif //Effort To Move Down EFTD1=WIDE and DOWNBAR and DOWNCLOSE and vol > vhigh and Vol[1]>Vol[2] EffortToMoveDown =EFTD1 if EffortToMoveDown then DrawText("EffortToMoveDown",barindex,high+atr*1.5,SansSerif,bold,12)coloured(200,0,0) DrawText("●",barindex,high,SansSerif,bold,15)coloured(200,0,0) endif //Effort To Move Up EFTU1=WIDE and UPBAR and UPclose and vol > vhigh and Vol[1]>Vol[2] EffortToMoveup = EFTU1 if EffortToMoveup then DrawText("EffortToMoveup",barindex,low-atr*1.5,SansSerif,bold,10)coloured(0,200,0) DrawText("●",barindex,low,SansSerif,bold,15)coloured(0,200,0) endif Return |
Share this
No information on this site is investment advice or a solicitation to buy or sell any financial instrument. Past performance is not indicative of future results. Trading may expose you to risk of loss greater than your deposits and is only suitable for experienced investors who have sufficient financial means to bear such risk.
ProRealTime ITF files and other attachments :
Find other exclusive trading pro-tools on ![]()
PRC is also on YouTube, subscribe to our channel for exclusive content and tutorials


//Last Code adapted 06/21/2018.
vol=volume
atr = averagetruerange[10](close)*0.5
mm= average[100](volume)
VolumeMA = Average[50](mm)
Vlow = (VolumeMA – ((VolumeMA * 75) / 100))
VolumeMAA = Average[50](mm)
Vhigh = (VolumeMAA + ((VolumeMAA * 50) / 100))
Spread3= Average[50](SPREAD1)
SPREAD1 = High -low/2
Spread2= Abs(High[0]-Low[0])
WIDE= (SPREAD1[0] > Spread2[1]*1.8)
NARROWS= SPREAD1[0] = open[0])
DOWNBAR =(close[0] <= open[0])
DOWNCLOSE=(Close[0]=(High[1]-((High[0]-Low[1])*0.3)))
UP=max(UPCLOSE, UPBAR)
Down= min(DOWNBAR, DOWNCLOSE)
//Move Price
if UP then
DrawText(“▴”,barindex,low,SansSerif,bold,15)coloured(0,255,0)
endif
if Down then
DrawText(“▾”,barindex,high,SansSerif,bold,15)coloured(200,0,0)
endif
//Divergence —- anomaly Price & Volume
ND1=(abs(open – close) mm and up
ND2=open[1] < close and vol < vol[1] and close[1] vhigh[1] and DOWNclose and Close[2]>Close[3] and High[1]>High[2]
ND= ND1 or ND2 or ND3
if ND then
DrawText(“●”,barindex,High,SansSerif,bold,15)coloured(200,0,0)
endif
//NoDemand
ND1= Vol[1] < vol[2] and UPCLOSE and DOWNBAR and (abs(open – close) <= (high – low)/2 )
ND2 = vol < Vlow and Vol[0] close[1] and close > open and close <= open[1] and close[1] <= open and close – open < open[1] – close[1] ) and (abs(open – close) <= (high – low) * 5/100) and Vol[1] Close[2] and Close[1] < MIDCLOSE and narrows and Vol[1] < vol[2] and Vol[2] Vhigh[1] and Vol[1] > Vhigh[2]
StoppingVolume = STPV1
if StoppingVolume then
DrawText(“StopVolume”,barindex,low-atr*0.5,SansSerif,bold,10)coloured(135,135,135)
DrawText(“●”,barindex,high,SansSerif,bold,10)coloured(135,135,135)
endif
NSP1= (Close[1] < Close[2] and Close[1] Vhigh[2])
//NO Supply
NOSupply = NSP1
if NOSupply then
DrawText(“NOSupply”,barindex,low-atr*1,SansSerif,bold,10)coloured(0,200,0)
DrawText(“●”,barindex,low,SansSerif,bold,12)coloured(0,200,0)
endif
TESNSP1=(Close[1] UP and Vol[1] < Vol[2] and Vol[0] Vhigh[1] and vol[2] > vol[3] and Close[2]>Close[3] and High[1]>High[2]
TESNSP3= wide and UP and Vol > Vhigh[1] and vol[2] > vol[3] and Close[2]<Close[3] and low[1]<low[2]
//Test for Supply
TESNSP = TESNSP1 or TESNSP2 or TESNSP3 and UPTHRUST
if TESNSP then
DrawText("Test for Supply",barindex,high+atr*1.4,SansSerif,bold,10)coloured(0,90,190)
DrawText("●",barindex,high,SansSerif,bold,12)coloured(0,90,190)
endif
//"Reverse UPTHRUST"
RUT1= (Close[1] < Close[2] and Close[1] vhigh[1] and vol[1] > vhigh[2] )
ReverseUPTHRUST = RUT1
if ReverseUPTHRUST then
DrawText(“Reverse UPTHRUST”,barindex,low-atr*1.5,SansSerif,bold,10)coloured(0,200,0)
DrawText(“●”,barindex,low,SansSerif,bold,15)coloured(0,200,0)
endif
//UPTHRUST
UT1 =(Close[1] > Close[2] and Close[1] > MIDCLOSE and Low[1] < Low[2] and Low[2] vol[2])
UPTHRUST= UT1
if UPTHRUST then
DrawText(“UPTHRUST”,barindex,high+atr*1,SansSerif,bold,10)coloured(200,0,0)
DrawText(“●”,barindex,high,SansSerif,bold,15)coloured(200,0,0)
endif
//Effort To Move Down
EFTD1=WIDE and DOWNBAR and DOWNCLOSE and vol > vhigh and Vol[1]>Vol[2]
EffortToMoveDown =EFTD1
if EffortToMoveDown then
DrawText(“EffortToMoveDown”,barindex,high+atr*2, SansSerif,bold,10)coloured(200,0,0)
DrawText(“●”,barindex,high,SansSerif,bold,15)coloured(200,0,0)
endif
//Effort To Move Up
EFTU1=WIDE and UPBAR and UPclose and vol > vhigh and Vol[1]>Vol[2]
EffortToMoveup = EFTU1
if EffortToMoveup then
DrawText(“EffortToMoveup”,barindex,low-atr*2,SansSerif,bold,10)coloured(0,200,0)
DrawText(“●”,barindex,low,SansSerif,bold,15)coloured(0,200,0)
endif
Return
Sorry is a code that will be improved day by day.
Do not forget to always copy the last code to be updated.
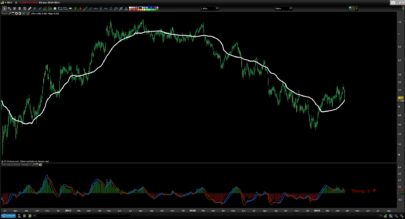
This indicator is a way to learn the relationship Price Volume
There are no signs of entry or exit in the markets.
Interpretation of the indicator
https://www.tiburonesdealetacorta.com/2018/06/tac-vsa-volume-spread-analysis.html
//Last improved code 06/24/2018 Version-V3
////////////////////////////////////////////////////////////////////////
REM VSA Volume
REM TAC VSA | indicator
REM 09.06.2018
REM RB @ http://www.tiburonesdealetacorta.com
REM Sharing http://www.tiburonesdealetacorta.com
////////////////////////////////////////////////////////////////////////
vol=volume
atr = averagetruerange[10](close)*0.5
mm= average[100](volume)
VolumeMA = Average[50](mm)
Vlow = (VolumeMA – ((VolumeMA * 75) / 100))
VolumeMAA = Average[50](mm)
Vhigh = (VolumeMAA + ((VolumeMAA * 50) / 100))
Spread3= Average[50](Spread1)
Spread1 = High -low/2
Spread2= Abs(High[0]-Low[0])
WIDE= (Spread1[0] > Spread2[1]*1.8)
NARROWS= Spread1[0] = open[0])
DOWNBAR =(close[0] <= open[0])
DOWNCLOSE=(Close[0]=(High[1]-((High[0]-Low[1])*0.3)))
UP=max(UPCLOSE, UPBAR)
Down= min(DOWNBAR, DOWNCLOSE)
//Move Price
if UP then
DrawText(“▴”,barindex,low,SansSerif,bold,15)coloured(0,255,0)
endif
if Down then
DrawText(“▾”,barindex,high,SansSerif,bold,15)coloured(200,0,0)
endif
//Divergence —- anomaly Price & Volume
d = close – open
DV1=(abs(open – close) mm and up
DV2=open[1] < close and vol < vol[1] and close[1] vhigh[1] and DOWNclose and Close[2]>Close[3] and High[1]>High[2] and Vol d[1]*2 and d[1] > 0 and d 0 and vol d[1]*2 and d[1] > 0 and d 0 and vol > vol[1]
DV= DV1 or DV2 or DV3 or DV4
if DV then
DrawText(“●”,barindex,High,SansSerif,bold,10)coloured(200,0,0)
endif
//NoDemand
ND1= Vol[1] < vol[2] and UPCLOSE and DOWNBAR and (abs(open – close) <= (high – low)/2 )
ND2 = vol < Vlow and Vol[0] close[1] and close > open and close <= open[1] and close[1] <= open and close – open < open[1] – close[1] ) and (abs(open – close) <= (high – low) * 5/100) and Vol[1] Close[2] and Close[1] < MIDCLOSE and narrows and Vol[1] < vol[2] and Vol[2] < vol[3])
ND5=Close average[20](vol)
NoDemand = ND1 or ND2 or ND3 or ND4 or ND5 and UPTHRUST
if NoDemand then
DrawText(“NODemand”,barindex,high+atr*1,SansSerif,bold,10)coloured(200,0,0)
DrawText(“●”,barindex,high,SansSerif,bold,10)coloured(200,0,0)
endif
//Stopping Volume
STPV1= Vol[0] > Vhigh[1] and Vol[1] > Vhigh[2]
StoppingVolume = STPV1
if StoppingVolume then
DrawText(“StopVolume”,barindex,low-atr*0.5,SansSerif,bold,10)coloured(135,135,135)
DrawText(“●”,barindex,high,SansSerif,bold,10)coloured(135,135,135)
endif
NSP1= (Close[1] < Close[2] and Close[1] Vhigh[2])
NSP2 =Close > Close[1] and Low=Lowest[10](Low) and Vol>average[20](vol)
//NO Supply
NOSupply = NSP1 or NSP2
if NOSupply then
DrawText(“NOSupply”,barindex,low-atr*1,SansSerif,bold,10)coloured(0,200,0)
DrawText(“●”,barindex,low,SansSerif,bold,10)coloured(0,200,0)
endif
TESNSP1=(Close[1] UP and Vol[1] < Vol[2] and Vol[0] Vhigh[1] and vol[2] > vol[3] and Close[2]>Close[3] and High[1]>High[2]
TESNSP3= wide and UP and Vol > Vhigh[1] and vol[2] > vol[3] and Close[2]<Close[3] and low[1]<low[2]
//Test for Supply
TESNSP = TESNSP1 or TESNSP2 or TESNSP3 and UPTHRUST
if TESNSP then
DrawText("Test for Supply",barindex,high+atr*1.8,SansSerif,bold,10)coloured(0,90,190)
DrawText("●",barindex,high,SansSerif,bold,10)coloured(0,90,190)
endif
//"Reverse UPTHRUST"
RUT1= (Close[1] < Close[2] and Close[1] vhigh[1] and vol[1] > vhigh[2] )
ReverseUPTHRUST = RUT1
if ReverseUPTHRUST then
DrawText(“Reverse UPTHRUST”,barindex,low-atr*1.5,SansSerif,bold,10)coloured(0,200,0)
DrawText(“●”,barindex,low,SansSerif,bold,12)coloured(0,200,0)
endif
//UPTHRUST
UT1 =(Close[1] > Close[2] and Close[1] > MIDCLOSE and Low[1] < Low[2] and Low[2] vol[2])
UPTHRUST= UT1 and EffortToMoveDown
if UPTHRUST then
DrawText(“UPTHRUST”,barindex,high+atr*1.5,SansSerif,bold,10)coloured(200,0,0)
DrawText(“●”,barindex,high,SansSerif,bold,10)coloured(200,0,0)
endif
//Effort To Move Down
EFTD1=WIDE and DOWNBAR and DOWNCLOSE and vol > vhigh and Vol[1]>Vol[2]
EffortToMoveDown =EFTD1
if EffortToMoveDown then
DrawText(“EffortToMoveDown”,barindex,high+atr*2, SansSerif,bold,10)coloured(200,0,0)
DrawText(“●”,barindex,high,SansSerif,bold,12)coloured(200,0,0)
endif
//Effort To Move Up
EFTU1=WIDE and UPBAR and UPclose and vol > vhigh and Vol[1]>Vol[2]
EffortToMoveup = EFTU1
if EffortToMoveup then
DrawText(“EffortToMoveup”,barindex,low-atr*2,SansSerif,bold,10)coloured(0,200,0)
DrawText(“●”,barindex,low,SansSerif,bold,12)coloured(0,200,0)
endif
Return
The download link of the .itf file !!! Always returns on version 1 and not on version 2.
Hello there is an error when copying the data in Prorealcode that we have reported …
Please download new versions from this link.
Version V3
https://www.tiburonesdealetacorta.com/2018/06/tac-vsa-volume-spread-analysis.html
When we copy the latest version in the comment section. Syntax error line 21 “)” which once corrected, returns a syntax error line 38 and 39!
Hello there is an error when copying the data in Prorealcode that we have reported …
Please download new versions from this link.
Version V3
https://www.tiburonesdealetacorta.com/2018/06/tac-vsa-volume-spread-analysis.html
Good… 😉
Please download new versions from this link.
Version V4
https://www.tiburonesdealetacorta.com/2018/06/tac-vsa-volume-spread-analysis.html
Thank You…
Great Job 😉
Please download new versions from this link.
Version V5
https://www.tiburonesdealetacorta.com/2018/06/tac-vsa-volume-spread-analysis.html
SHAKE OUT
Is there a way to develop a scan for the shakeout?
Sorry,
I do not program screener
Please download new versions from this link.
Version V8
https://www.tiburonesdealetacorta.com/2018/06/tac-vsa-volume-spread-analysis.html
Does this indicator repainting his signals or not? Thanks in advance for your answer.
or does this indicator lag in the way of displaying the defined signals or not?
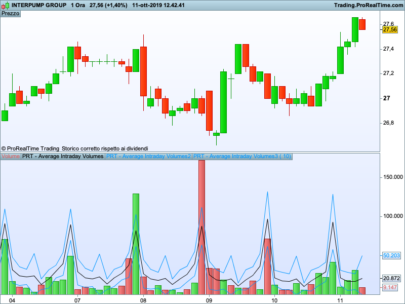
You have to use it in daily or higher graphs to make a correct volume analysis
In market closures is when between arbitrage,blocks, hidden orders. etc..
Ok thanks a lot for your info and work.
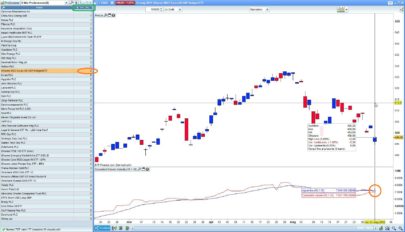
Hello, the problem is that the UPTHRUST and SHAKEOUT signals are displaying with 8-9 days delay
Is it normal or not?
….in daily time frame
Can you send me an editable version 8 of this indicator or not?
You confuse the reading of the volume.
In order for a UPTHRUST to be fulfilled, it is followed by a valid Hidden Test and it does not recover the zone otherwise it would not be a UPTHRUST, the same case for the Shakeout.
The indicator reads from the past and waits the future to mark signals can be given in the next candle or in 10 candles.
Marked the signal with that delay where the test validates the price action.
This indicator does not give a signal of entry or exit from the market.
UPTHRUST or Shakeout is read in context after a test,
These signals alone in the price is like having “a rocket without a deposit” Tom Wiliiams.
Regarding the code can not be opened because it incorporates the cumulative delta and this code is private on all platforms.
I recommend you read Wyckoff and then Tom Williams to understand this indicator.
If you look for an indicator that is sailing, use the indicator
https://www.prorealcode.com/prorealtime-indicators/bill-williams-profitunity/
Hey, thanks i made a little research with the links you provide on your website and i read Wyckoff so i understand what this whole thing is about now, Actually, there is a lot to read.
As you said, i thought your indicator gave trading signals but when i read your comments above yesterday, i understood that you created this indicator for research purpose, it was too good to be true.
I understand a little bit what is a shakeout now but as i am obstinate i am still wondering if a shakeout indicator could be created with other parameters that could be useful in the test in order to use less than 10 candles to insure the probability about the realisation of what we call “a shakeout” in modern trading. I checked also the Profitunity indicator yesterday and i am currently use it i think it is an excellent indicator for daytrading so crongratulation and thanks to you for having taken the time to answer my previous questions.
Hi TAC,
Thanks a lot for this great piece of work; -) MUCHAS gracias 😉
did I read right, you cannot give us the conditions to identify the shakeout?
All indicators share some code of other TAC indicators that improve the functioning of this …
This in some cases has an owner .. and these do not authorize the sharing of the code but the yes use of the indicator by third parties with the code blocked.
For my part, being the programmer to be grateful that they authorize us to share the indicator for free, even if it is blocked.
Hi Tac,
Great job. Please, can you provide latest code version of this indicator without any private code?
Thanks in advance.
Regards.
Hi Tac, pls provide latest code version of this indicator. Thanks in advance.