
One-line summary:
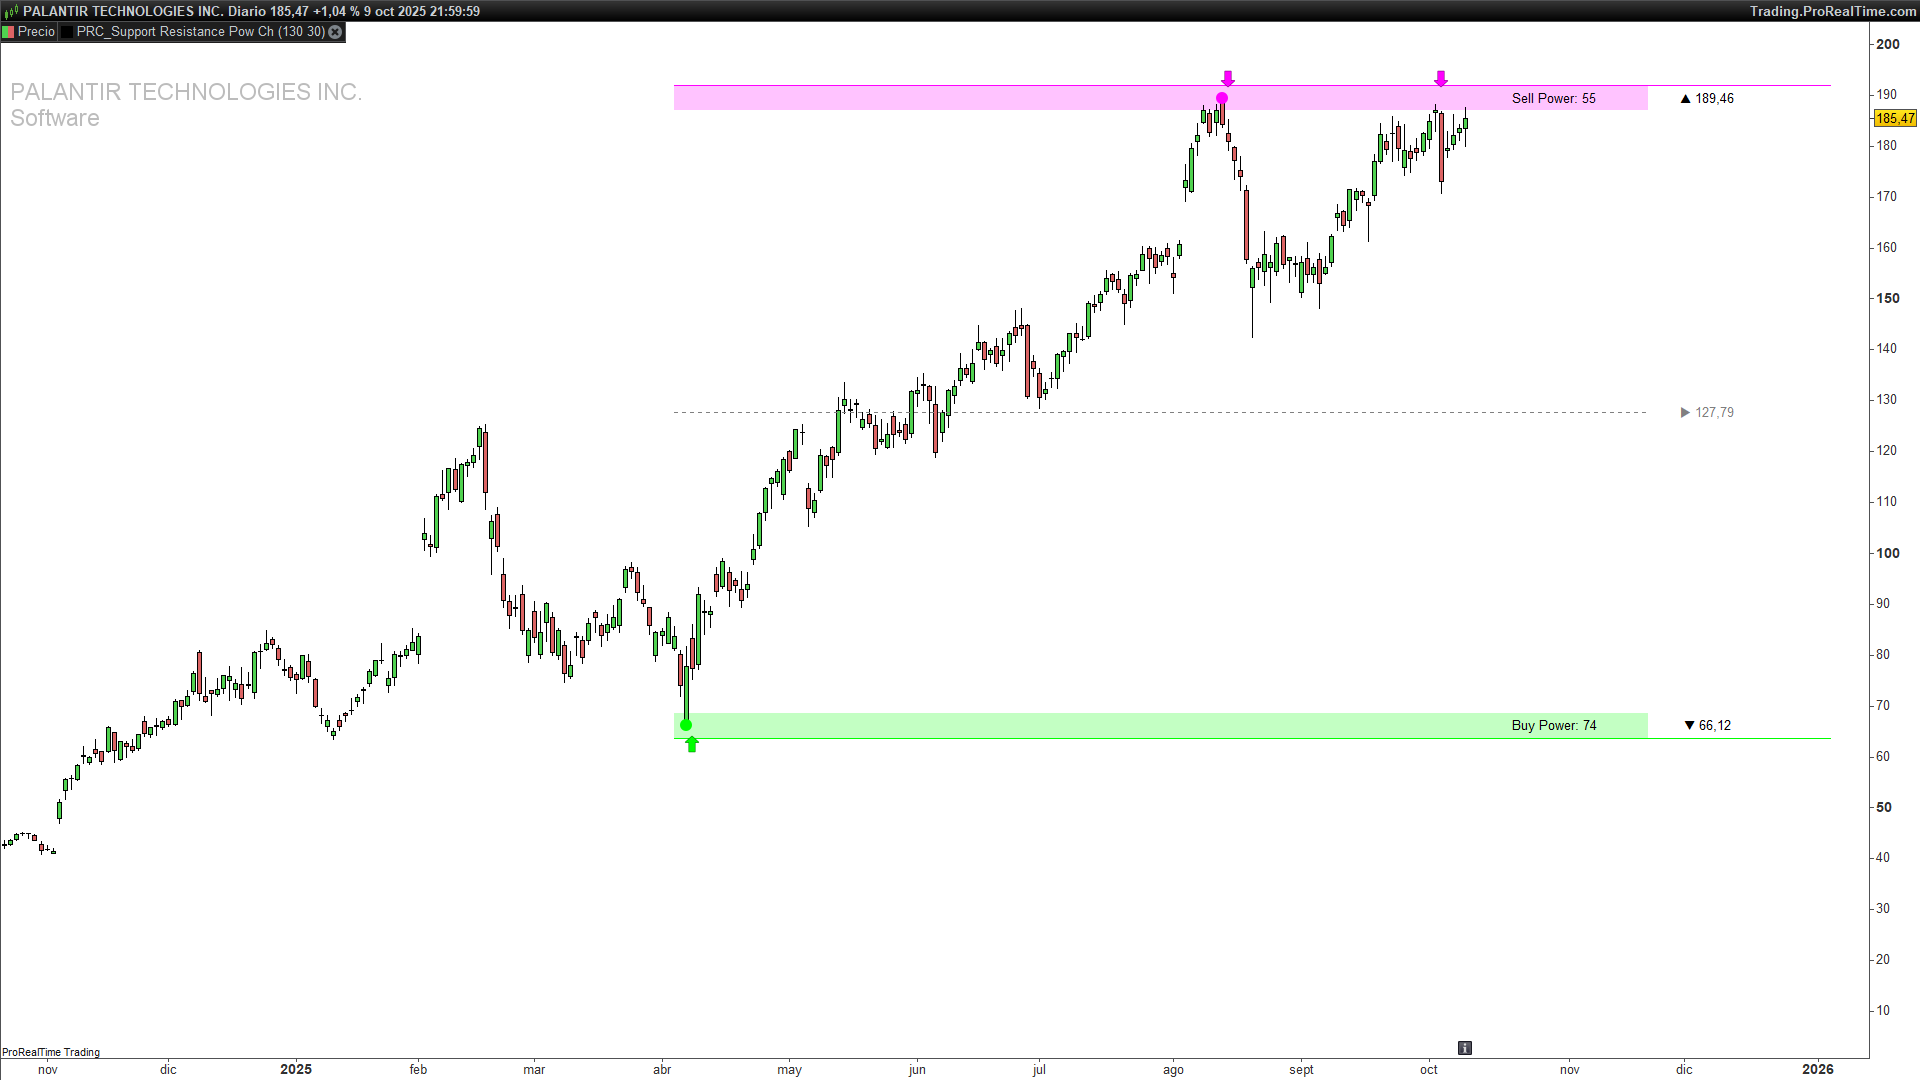
A dynamic support/resistance channel that highlights recent extremes, projects actionable zones forward with ATR-based thickness, and quantifies “Buy vs. Sell Power” to gauge who’s in control.
1) What This Indicator Does
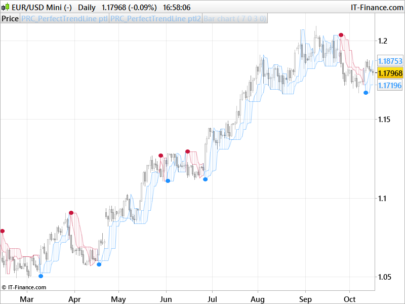
This tool builds a power channel using the highest high and lowest low over a configurable lookback. It then expands these bounds into support/resistance areas using a volatility buffer (ATR), plots a midline as a quick gravity center, and marks tests (touches/crosses) of the zones. On top of that, it tallies how many candles were bullish vs. bearish in the lookback window, displaying Buy Power and Sell Power as an ultra-fast market read.
At a glance, you get:
-
A resistance area around the recent highest high.
-
A support area around the recent lowest low.
-
A midline for mean-reversion context.
-
Arrows/points to call out zone tests and exact extremes.
-
Buy/Sell Power labels to judge recent pressure.
2) How It Works
a) Lookback highs & lows
The indicator computes:
-
maxVal= highest high overlength. -
minVal= lowest low overlength. -
midVal= (maxVal+minVal) / 2.
b) Volatility buffer (zone thickness)
It uses AverageTrueRange[200] * 0.5 to define half-ATR bands around the top and bottom levels. The result is a thickness that adapts to current volatility:
-
Resistance area spans
maxVal + ATR*0.5tomaxVal - ATR*0.5. -
Support area spans
minVal + ATR*0.5tominVal - ATR*0.5.
c) Forward projection
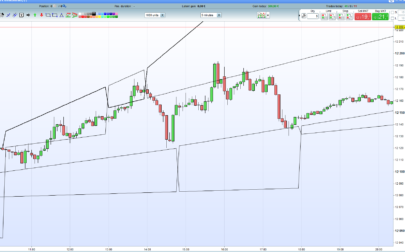
Zones are drawn from barindex - length (left anchor) to barindex + extend (right projection), so you see the channel ahead of current price action.
d) Buy vs. Sell Power
Over the last length candles, the script counts:
-
Buy Power: bars where
close > open. -
Sell Power: bars where
close < open.
Neutral candles (dojis) are ignored. Labels are placed near the support/resistance to keep context on the same vertical scale.
e) Zone tests & markers
-
A support test is flagged when price reclaims the top of the support band from below (low crosses above
topOfSupport), printing an up arrow under the zone. -
A resistance test is flagged when price rejects from the bottom of the resistance band (high crosses below
bottomOfResistance), printing a down arrow above the zone. -
Exact occurrences of the absolute high and absolute low in the window are point-marked for precision.
3) Inputs & Defaults
-
length(integer) — Lookback window for highs/lows and power count.-
Typical values: 100–200.
-
Example default:
length = 130.
-
-
extend(integer) — Forward projection (how far to extend drawings to the right).-
Typical values: 15–50 depending on chart timeframe.
-
Example default:
extend = 30.
-
-
Colors & opacity (RGBA)
-
Top zone (resistance):
tcolR=255, tcolG=0, tcolB=255(magenta tone) -
Bottom zone (support):
bcolR=0, bcolG=255, bcolB=0(green tone) -
Fill transparency:
alpha = 60(soft overlay)
Tweak to match your chart theme.
-
-
ATR factor (implicit):
AverageTrueRange[200] * 0.5-
You can change the ATR period (e.g., 100, 50) or the multiplier (e.g., 0.35 / 0.75 / 1.0) to tighten or loosen the zones.
-
4) Plot Elements & Visual Guide
-
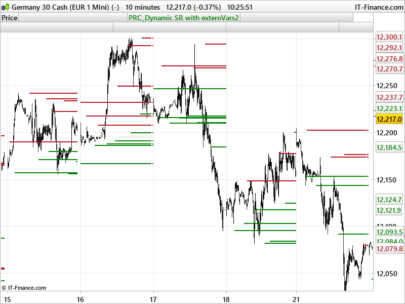
Resistance area:
Rectangle + top guideline + “▲ #maxVal#” label at the right extension.
Useful to spot supply and potential exhaustion. -
Support area:
Rectangle + lower guideline + “▼ #minVal#” label.
Useful to spot demand and potential absorption. -
Midline (dotted):
Horizontal line at the midpoint betweenmaxValandminValwith a “▶ #midVal#” label.
Think of this as a balance point—helpful for mean-reversion bias. -
Tests:
-
Up arrows appear when price reclaims the top of support from below.
-
Down arrows appear when price rejects the bottom of resistance from above.
-
Points mark the exact bar(s) that set the window’s absolute high/low.
-
-
Buy/Sell Power labels:
Plotted to the right of price (halfway into the extension), aligned with the top/bottom zones for instant context.
5) How to Use It in Practice
A) Bounce mindset (range conditions)
-
Prefer longs near support area when tests fire upward (up arrows) and Buy Power ≥ Sell Power.
-
Prefer shorts near resistance area when tests fire downward (down arrows) and Sell Power ≥ Buy Power.
B) Breakout mindset (trend conditions)
-
A strong close beyond the resistance area with rising Buy Power tilts bias to continuation.
-
A decisive close below the support area with rising Sell Power favors continuation down.
C) Midline behavior
-
In choppy markets, price frequently gravitates to the midline after an extreme; watch for reversion trades back to midline when tests appear at the band edges.
-
In strong trends, the midline often flips from magnet to support/resistance. Treat touches as continuation opportunities if power counts agree.
D) Multi-timeframe tips
-
Use a higher timeframe channel for regime and key levels, then execute on a lower timeframe when tests or breakouts align with the bigger picture.
Nothing here is financial advice; this is a visual decision aid. Always test and manage risk.
6) Parameter Tuning & Examples
-
Increase
lengthfor smoother, more stable zones (great for higher timeframes or swing bias). -
Decrease
lengthfor reactive zones (scalping/intraday), at the cost of more frequent changes. -
Increase
extendwhen you want the levels to stay visible further into the right margin (handy for planning). -
Decrease
extendto declutter on smaller screens or lower timeframes. -
ATR period & factor
-
Shorter ATR or larger multiplier → thicker zones (more tolerance, fewer false tests).
-
Longer ATR or smaller multiplier → thinner zones (tighter precision, more tests).
-
-
Color & opacity
-
Keep high contrast but avoid fully opaque fills; the default
alpha=60is a good balance.
-
7) Trade Ideas & Rules of Thumb (Non-Financial Advice)
-
Conservative bounce
-
Wait for an up arrow at support (or down arrow at resistance), then a confirming candle in your direction.
-
Stops just outside the zone (e.g., beyond 1× to 1.5× the ATR buffer).
-
Consider partial profits near midline, trail remainder toward the opposite band.
-
-
Aggressive breakout
-
Enter on a close beyond a band with power count in favor (Buy>Sell for upside, vice versa for downside).
-
Invalidations: return into the zone or power count flipping the other way.
-
Trail using recent swing structure or a multiple of ATR.
-
-
Midline mean-reversion
-
If range-bound and power is balanced, look for fades from band → midline and midline → opposite band.
-
8) Limitations & Best Practices
-
Trending vs. ranging: Bounces are less reliable in strong trends; consider breakouts + pullbacks instead.
-
Late recognition: A very large
lengthmakes zones stable but slower to reflect regime shifts. -
Noise: Ultra-short settings may cause over-signaling; pair with structure (swings/volume) to filter.
-
Clarity: If the chart feels busy, reduce
extend, lighten fills, or hide midline until needed.
9) ProBuilder Code
|
1 2 3 4 5 6 7 8 9 10 11 12 13 14 15 16 17 18 19 20 21 22 23 24 25 26 27 28 29 30 31 32 33 34 35 36 37 38 39 40 41 42 43 44 45 46 47 48 49 50 51 52 53 54 55 56 57 58 59 60 61 62 63 64 65 66 67 68 69 70 71 72 73 74 75 76 77 78 79 80 81 82 83 84 85 86 87 |
// ----------------------------------------------- // PRC_Support and Resistance Power Channel [ChartPrime] //version = 0 //07.10.2025 //Iván González @ www.prorealcode.com //Sharing ProRealTime knowledge // ----------------------------------------------- // INPUTS // ----------------------------------------------- DEFPARAM DRAWONLASTBARONLY = true length = 130 extend = 30 // COLOURS tcolR = 255 tcolG = 0 tcolB = 255 bcolR = 0 bcolG = 255 bcolB = 0 alpha = 60 // ----------------------------------------------- // CALCULATION SUPPORT AND RESISTANCE AREA // ----------------------------------------------- // ATR atr = AverageTrueRange[200] * 0.5 // HIGHEST AND LOWEST PRICE maxVal = HIGHEST[length](high) minVal = LOWEST[length](low) midVal = (maxVal + minVal) / 2 // ----------------------------------------------- // DRAW SUPPORT AND RESISTANCE AREA // ----------------------------------------------- if islastbarupdate then maxOffset = barssince(high=maxVal) minOffset = barssince(low=minVal) // RESISTANCE AREA DRAWRECTANGLE(barindex - length, maxVal + atr, barindex + extend, maxVal - atr) fillcolor(tcolR, tcolG, tcolB, alpha)COLOURED(tcolR, tcolG, tcolB,0) DRAWSEGMENT(barindex - length, maxVal + atr, barindex + extend + 30, maxVal + atr) COLOURED(tcolR, tcolG, tcolB) DRAWTEXT("▲ #maxVal#", barindex + extend + 10, maxVal) // SUPPORT AREA DRAWRECTANGLE(barindex - length, minVal + atr, barindex + extend, minVal - atr) fillcolor(bcolR, bcolG, bcolB, alpha)COLOURED(bcolR, bcolG, bcolB, 0) DRAWSEGMENT(barindex - length, minVal - atr, barindex + extend + 30, minVal - atr) COLOURED(bcolR, bcolG, bcolB) DRAWTEXT("▼ #minVal#", barindex + extend + 10, minVal) // MIDDLE LINE DRAWSEGMENT(barindex - length, midVal, barindex + extend, midVal) COLOURED(128, 128, 128) STYLE(DOTTEDLINE, 1) DRAWTEXT("▶ #midVal#", barindex + extend + 10, midVal) COLOURED(128, 128, 128) // BUY AND SELL POWER buyPower = 0 sellPower = 0 FOR i = 0 TO length - 1 DO IF close[i] > open[i] THEN buyPower = buyPower + 1 ELSIF close[i] < open[i] THEN sellPower = sellPower + 1 ENDIF NEXT textPosX = barindex + round(extend*0.5) DRAWTEXT("Sell Power: #sellpower#", textPosX, maxVal) DRAWTEXT("Buy Power: #buypower#", textPosX, minVal) // DRAW SUPPORT AND RESISTANCE TESTS topOfSupport = minVal + atr bottomOfResistance = maxVal - atr FOR i = 0 TO length - 1 DO IF low[i+1] <= topOfSupport AND low[i] > topOfSupport THEN DRAWARROWUP(barindex - i, minval - atr*1.5) COLOURED(bcolR, bcolG, bcolB) ENDIF IF high[i+1] >= bottomOfResistance AND high[i] < bottomOfResistance THEN DRAWARROWDOWN(barindex - i, maxval + 1.5*atr) COLOURED(tcolR, tcolG, tcolB) ENDIF if high[i]=maxval then drawpoint(barindex[i],maxval,3)coloured(tcolR, tcolG, tcolB) endif if low[i]=minval then drawpoint(barindex[i],minval,3)coloured(bcolR, bcolG, bcolB) endif NEXT endif return |
Share this
No information on this site is investment advice or a solicitation to buy or sell any financial instrument. Past performance is not indicative of future results. Trading may expose you to risk of loss greater than your deposits and is only suitable for experienced investors who have sufficient financial means to bear such risk.
ProRealTime ITF files and other attachments :
Find other exclusive trading pro-tools on ![]()
PRC is also on YouTube, subscribe to our channel for exclusive content and tutorials


thanks.
Thank a lot Ivan! Is it possible have a bot that enter on the arrow?
Hello Ivan, is it possible have the bot related to this indicator? Thank you in andvance!!!
You would have to enter the buy instructions, but I don’t think you’ll get good results without doing anything else.
if not onmarket and low[1]<=topOfSupport and low>topOfSupport then
buy 1 contract at market
endif
if not onmarket and high[1]>=bottomOfResistance and high>bottomOfResistance then
sellshort 1 contract at market
endif
Che cosa sono quei numeri a destra di Sell power e Buy power?
d) Buy vs. Sell Power
Over the last length candles, the script counts:
Buy Power: bars where close > open.
Sell Power: bars where close < open.
Neutral candles (dojis) are ignored. Labels are placed near the support/resistance to keep context on the same vertical scale.
Hello Ivan is it possible to have an histogram version giving +1 when you have a green arrow and -1 when you have a magenta arrow. The idea is to be able to create an alert in real time on each arrow. Thanks for you help