Stiffness indicator (by Markos Katsanos)
This indicator was first introduced in my November 2018 article in
Technical Analysis of STOCKS & COMMODITIES.
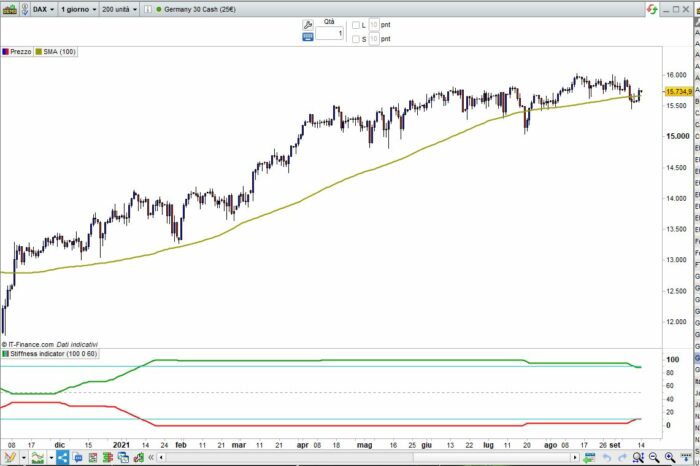
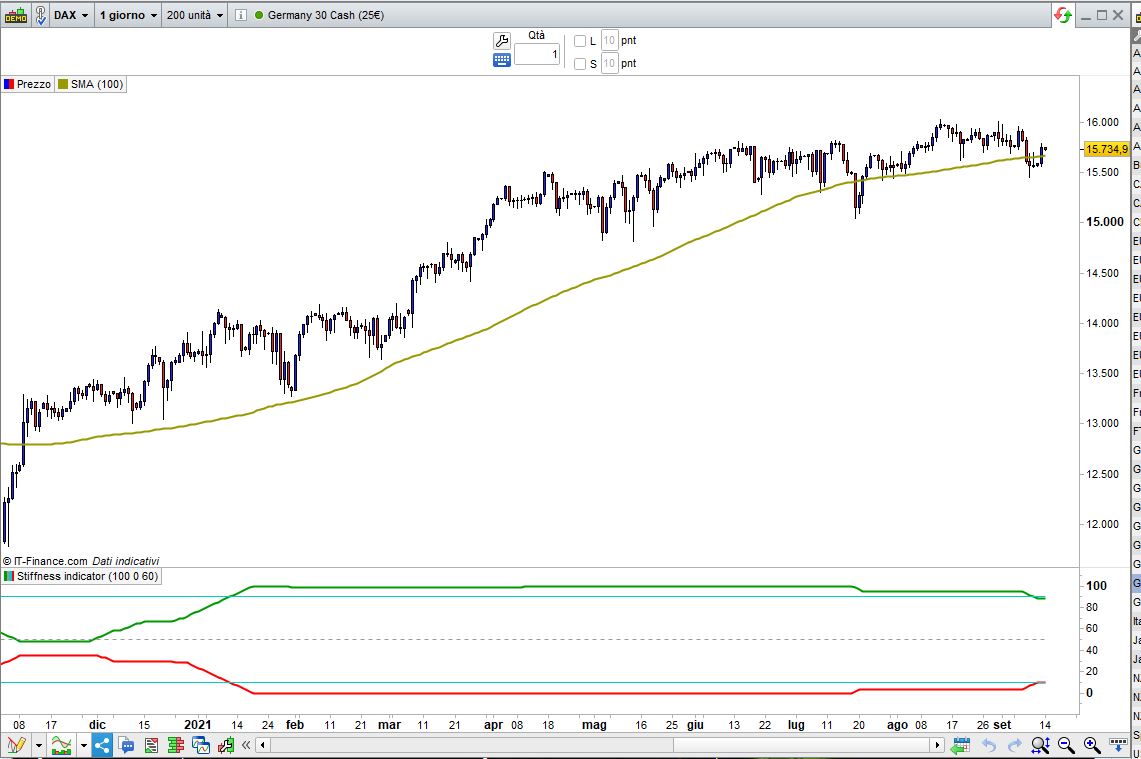
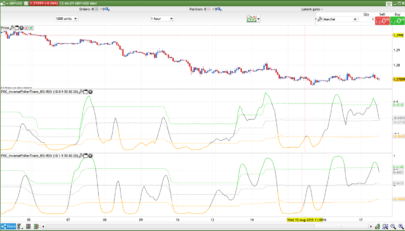
It basically attempts to recognize strong price trends by counting the number of times
that price was above the 100 day the moving average during the indicator period. The
premise is that the less times that price penetrates the moving average, the stronger
the trend is, suggesting less erratic prices in the future as well. I also introduced
a volatility threshold that excludes minimal penetrations of less than 0.2 standard deviations.
The default moving average is 100 days and the indicator period is 60 days.
|
1 2 3 4 5 6 7 8 9 10 11 12 13 14 15 16 17 18 |
//P = 100 //MA periods (defaults to 100) //T = 0 //Average type (0=sma): // // (https://www.prorealcode.com/documentation/average/) //LB = 60 //LookBack periods P = max(1,min(999,P)) //range allowed: 1-999 LB = max(1,min(999,LB)) //range allowed: 1-999 T = max(0,min(8,T)) //available average types: 0-8 // Sma100 = Average[P,T](close) //calculate SMA SmaL = Sma100 + (0.2 * STD[P](close)) //add a buffer for LONG trends SmaS = Sma100 - (0.2 * STD[P](close)) //subtract a buffer for SHORT trends // ContoL = summation[LB](close > SmaL) //tally how many times CLOSE was above SMA in the LB period ContoS = summation[LB](close < SmaS) //tally how many times CLOSE was below SMA in the LB period // StiffL = 100 * (ContoL / LB) //UPtrend % StiffS = 100 * (ContoS / LB) //DOWNtrend % RETURN StiffL AS "UPtrend %",StiffS AS "DOWNtrend %",90 AS "90",10 AS "10",50 as "50" |
Share this
No information on this site is investment advice or a solicitation to buy or sell any financial instrument. Past performance is not indicative of future results. Trading may expose you to risk of loss greater than your deposits and is only suitable for experienced investors who have sufficient financial means to bear such risk.
ProRealTime ITF files and other attachments :
Find other exclusive trading pro-tools on ![]()
PRC is also on YouTube, subscribe to our channel for exclusive content and tutorials
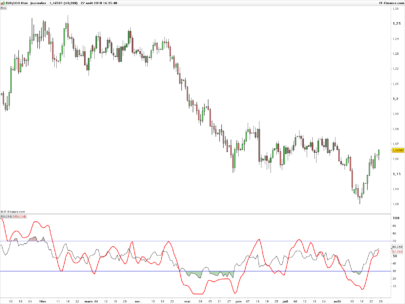
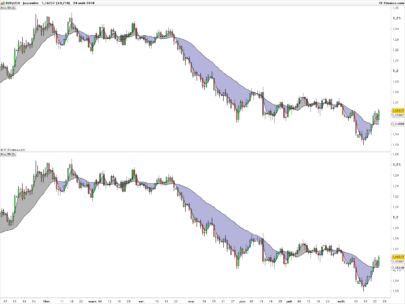


Excellent timing indicator to confirm or deny entries in the market, congratulations Roberto! Very interesting in FX.
Thanks for your work. Would you mind explaining briefly how the volatility threshold works, I am having a hard time wrapping my head around that
As the author said “I also introduced a volatility threshold that excludes minimal penetrations of less than 0.2 standard deviations”, lines 10-11 build the 0.2*STD buffer to get rid of minimal penetration, so that if the price is above or below the MA, but still within that 0.2 allowance, it’s not counted.