Skewness and Kurtosis indicator

Skewness and Kurtosis indicator

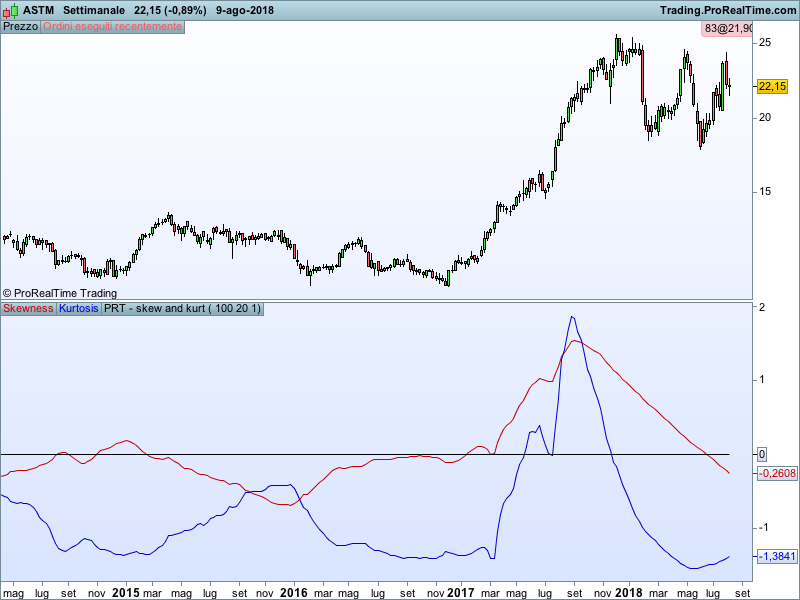
This indicator shows the skewness and kurtosis of a title. For all the statistic lovers 🙂

In probability theory and statistics, skewness is a measure of the asymmetry of the probability distribution of a real-valued random variable about its mean. The skewness value can be positive or negative, or undefined.
kurtosis is a measure of the “tailedness” of the probability distribution of a real-valued random variable. In a similar way to the concept of skewness, kurtosis is a descriptor of the shape of a probability distribution and, just as for skewness, there are different ways of quantifying it for a theoretical distribution and corresponding ways of estimating it from a sample from a population.


Blue skies!!


Share this

Risk disclosure:

No information on this site is investment advice or a solicitation to buy or sell any financial instrument. Past performance is not indicative of future results. Trading may expose you to risk of loss greater than your deposits and is only suitable for experienced investors who have sufficient financial means to bear such risk.

ProRealTime ITF files and other attachments : How to import ITF files into ProRealTime platform?

PRC is also on YouTube, subscribe to our channel for exclusive content and tutorials

  1. denmar • 08/10/2018 #

    Purple haze.

    • Nicolas • 08/10/2018 #

      ,all around Don’t know if I’m comin’ up or down!

  2. juanj • 08/10/2018 #

    This is very interesting but how is this to be interpreted?

  3. gabri • 08/10/2018 #

    This is not an indicator but just a tool to assess how the price relates to the average used. It can be helpful for all the people using Bollinger’s band and also for long term traders. How to read it. A skewness below 0.5 and above 0.5 is considered normal. Below -0.5 is skewed left, meaning that prices statistically have the tendency to be around the average but they had throughs below the average outside the standard deviations. Above 0.5 is the opposite. A kurtosis above 0 means that the majority of the prices are around the average and just a little amount of them are outside the standard deviation. As a reference when you see skewness around 0 and very high kurtosis the prices should have little volatility and they are more predictable. When Kurtosis is below 0 volatility is pretty high. This is the theory in a nutshell.

  4. luxrun • 08/10/2018 #

    gentile gabri, in the graph of the indicator skewness and curtosis I see three values indicated (100, 20, 1) while the only variable required by prt is periodo (which I tried at 20 and 100). The resulting graphs are different from those shown by you; Is this normal or is something missing in the instructions posted on prorealcode? Thank you

  5. gabri • 08/10/2018 #

    Luxrun, the second value is the period of the moving average and the third one the kind of average used (in this case exponential). In this code I didn’t paint the moving average but I like to have also showing a moving average of the skewness.

  6. Bard • 08/10/2018 #

    Thanks Gabri,

    How do you like your Turkey cooked?

    https://www.dropbox.com/s/1afg6qqqffgfasw/GBP-TurkLira.png?dl=0

  7. gabri • 08/10/2018 #

    Brined 🙂 look on this indicator how on the 6th and on the 9th you have very high positive skew (with right tails) and heavy kurtosis. It means that the big majority of the closes are 1 or 2 deviations standard below the average while peaks of closes 4/6 times the STD above the average start to appear. SIgns were building up already a few days ago.

  8. Pepsmile • 08/10/2018 #

    Hi everybody,
    An application could be found by applying this indicator on the strategy profit instead of the prices. What do you think?

  9. zilliq • 08/10/2018 #

    Thanks for your indicator Gabri but are you sure for your code because on EUR/USD for example I have a kurtosis of -100, -200 …
    You use a Fisher or Pearson approximation ?
    Sorry I can’t post a picture here
    Thanks

avatar
Register or

Likes

avatar avatar avatar avatar avatar avatar
Related users ' posts
Daniele Maddaluno Écrivez-moi où vous préférez you can easily find me on LinkedIn
AK27 C'est payant visiblement sur linkdin je peux pas vous envoyer, discord vous avez ?
Vinks_o_7 Vonasi you're a beast !!! ;-)))
pableitor Amazing indicator , you are pushing PRT to the limit! But looking at the scatter its not c...
Bard Excellent job Vonasi, thanks very much for updating and improving your previous indicator.
Gianluca sorry but doesnt work like you posted
Vonasi You would need to let me know the exact instrument and time frame that you are trying to app...
cfta Hi Fulvio, many thanks for sharing this clever indicator, much appreciated. As Pepsmile ment...
cfta Sorry adding the PRT to code didn't work in the above comment so I guess we will have to set...
juanj Something appears to be wrong with this formula as graphing t shows t to almost never be wit...
Rafa And the PriceMAPeriod? aren´t the same?
Nicolas The PriceMAPeriod is the period to make the average of all the last X medianprice found.
Rafa Thanks a lot Nicolás. Have a nice day
xel @DerPat - I don't see any question regarding the indicator.  Anyway, I think I give enough l...
diegofe_2000 Xel, tu eres el creador de este indicador? Bueno te  cuento que es muy bueno para hacer est...
xel Buen día @diegofe_2000 -  Claro, mandalo y por aquí lo probamos en otros instrumentos y si g...

Top