







Guppy's CBL (Count Back Line)
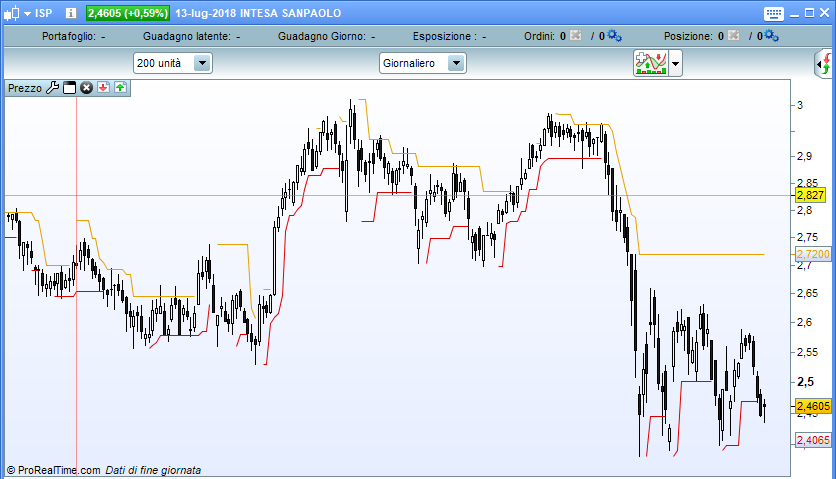
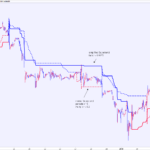
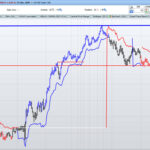
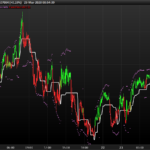
This is the Count Back Line. Basically, it is a volatility based indicator developed by Daryl Guppy.
You can find some info at his website (http://www.guppytraders.com/gup332.shtml), but a very clear description can be found in his book TREND TRADING.
Disclaimer: this is the first indicator I wrote so I don’t know if it is written correctly. Be careful!
// ==  S e t t i n g s  =============================
once CBLLOWRESET = 0
once MAXCYCLES = 15

// ==  C B L   ( l o w )  ===========================
once cblLow = CBLLOWRESET
once previousCblHigh = CBLLOWRESET

// When a new high appears, we try to find the 2 lower lows back
// TODO: optimize a little bit 'cause it is not required to cycle so many times every bar
if high > previousCblHigh then
 count = 0
 currentLow = low
 for i = 1 to MAXCYCLES do
  if low[i] < currentLow then
   currentLow = low[i]
   count = count +1
   if count = 2 then
    if currentLow > cblLow then
     cblLow = currentLow
     previousCblHigh = high
    endif
    break
   endif
  endif
 next
endif

// When the close is lower than CBL, it terminates
if close < cblLow then
 cblLow = CBLLOWRESET
 previousCblHigh = CBLLOWRESET
endif

// ==  C B L   ( h i g h )  =========================
once CBLHIGHRESET = 1000
once cblHigh = CBLHIGHRESET
once previousCblLow = CBLHIGHRESET

// When a new low appears, we try to find the 2 higher highs back
// TODO: optimize
if low < previousCblLow then
 count = 0
 currentHigh = high
 for i = 1 to MAXCYCLES do
  if high[i] > currentHigh then
   currentHigh = high[i]
   count = count +1
   if count = 2 then
    if currentHigh < cblHigh then
     cblHigh = currentHigh
     previousCblLow = low
    endif
    break
   endif
  endif
 next
endif

// When the close is higher than CBL, it terminates
if close > cblHigh then
 cblHigh = CBLHIGHRESET
 previousCblLow = CBLHIGHRESET
endif

// This is a trick found on prorealcode.com: basically when the
// value is a "reset" we don't want to see any line, so that it seems CBL
// is made of segments...
cblLowAlpha = 255
if cblLow = CBLLOWRESET or cblLow[1] = CBLLOWRESET then
 cblLowAlpha = 0
endif
cblHighAlpha = 255
if cblHigh = CBLHIGHRESET or cblHigh[1] = CBLHIGHRESET then
 cblHighAlpha = 0
endif
return cblLow coloured (220, 0, 0, cblLowAlpha), cblHigh coloured (230, 160, 0, cblHighAlpha)
Comments
You must be logged in to post a comment.

Sorry, I solved the problem. I have add the CBL indicator using the spanner icon on the price chart. I was adding it using the Indicator icon and the CBL indicator appears in its own window, below the price. However, there seems to be something wrong as the price chart is very compressed. I need price to open up more in the Y-axis direction. Any clues? Thanks


Thanks to you

Ah ok I found it. There is a weak point in my implementation and it is the variable CBLHIGHRESET at the 36th row. I valued it at 1000 just because I'm using this indicator on stocks where values are lower than that. Unfortunately I didn't think about all the instruments higher than that... I think I should implement the higher row in a different way (using an alternate value). At the moment if you change that variable at 100000 it should work. Can you try?
Oh sorry. Can you share the instrument on which you are using it so that I can test it? Thanks
Hello Your indicator is interesting. However, I can't see the orange line. Do you have any idea what the problem is?