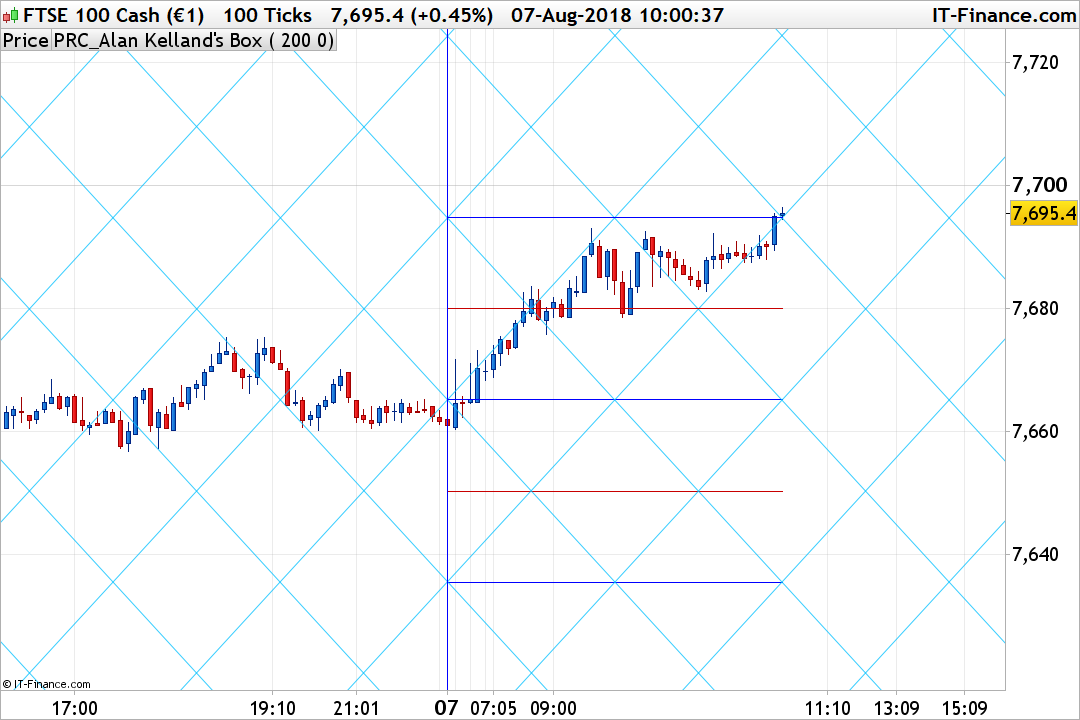
Alan Kelland’s Box – DaBox

v10.3
Alan Kelland’s Box – DaBox

This indicator is in relation to the Alan Kelland’s trading method called the “Alan Square” or “DaBox”. You might find a lot of information about this on the internet.

It has been coded from its description, requested in the English forum.

The indicator can plot the Alan Square from different time horizons:

  • 0 = daily timeframe
  • 1 = weekly timeframe
  • 2 = monthly timeframe
  • 3 = yearly timeframe

Some useful infos about the indicator:

A draw tool growing in popularity is the Alan Square, named after its inventor Alan Kelland.  Alan’s method is first and foremost price action.  The square serves as a structure to create

  • Opportunities
  • Targets and
  • Protection

The most important aspects are to look for only the best quality setups, focus on identifying follow through bars, and never fade a zone (i.e., never sell a support zone, never buy a resistance zone).

Background
Alan developed his methods trading the ten-minute all-sessions Dow Jones Index futures (YM contract).  This article and the trading strategies described reflects his work using that instrument.  They are suggested uses only and as such are not a complete compilation of all his methods.  However, traders have successfully applied the square to the S&P futures, DAX, Crude Oil, Euro, Bund, Bond, Russell and even stocks.  Similarly, while the method is geared towards 10-minute bars, Alan has also used the square on various intra-day time frames and Daily charts.  You are encouraged to experiment and find what works for you.

Though Alan does not use indicators (e.g., MACD, Stochastic, etc), many traders do and have added them to their charts.  Price action strategies that Alan has shared to take advantage of these opportunities, protections, and targets are summarized in this article.

Components
The major components of the Alan Square are:

1) Angulars

  • a) Major – Up and Down angulars from the High, Low, and square Midpoint.
  • b) Minor – Up and Down angulars parallel to the Major, but from the 25% and 75% quartiles.

    Note: Only Major angulars create opportunities.  Minor angulars are primarily used for protection.

2) Quartiles

  • Yesterdays Low – 0% level  (See below for how to determine Daily High and Daily Low)
  • Yesterday’s High – 100% level
  • Midpoint – 50% of yesterday’s Daily High and Daily Low
  • Quartiles 25% and 75% of yesterday’s High-Low range
  • Extensions (125% to 200% or more of High-Low range)


Share this

Risk disclosure:

No information on this site is investment advice or a solicitation to buy or sell any financial instrument. Past performance is not indicative of future results. Trading may expose you to risk of loss greater than your deposits and is only suitable for experienced investors who have sufficient financial means to bear such risk.

ProRealTime ITF files and other attachments : How to import ITF files into ProRealTime platform?

PRC is also on YouTube, subscribe to our channel for exclusive content and tutorials

  1. Maxime Baudin • 08/07/2018 #

    Really interesting! Thanks for sharing, have a great summer!

  2. Onega • 08/07/2018 #

    Sorry, a quick question I cannot see on forum please ?…Using ProScreener, how can we get the full list of stocks that meet the criteria, not just the top 50 ?
    Thank you,

  3. Pepsmile • 08/07/2018 #

    Interesting !
    Anybody knows how could we add 4 hours timeframe simply to the 4 timeframes proposed without using the new timeframe feature available only in Probacktest ?

    • Nicolas • 08/07/2018 #

      The indicator may be not as accurate with the initial version, see discussion here: https://www.prorealcode.com/topic/req-alans-box/
      I’m waiting for a reply from @rapid

  4. maurizio • 08/07/2018 #

    A me non funziona errore nella riga 11 e 13

  5. maurizio • 08/07/2018 #

    //PRC_Alan Kelland’s Box | indicator
    //07.08.2018
    //Nicolas @ http://www.prorealcode.com
    //Sharing ProRealTime knowledge

    // — settings
    alpha = 100 //alpha transparency of angular lines
    mymyTimeframe = 0 //0=daily , 1=weekly , 2=monthly, 3=yearly
    // — end of settings

    defparam drawonlastbaronly=true

    if myTimeframe=0 then
    hh=dhigh(1)
    ll=dlow(1)
    if intradaybarindex=0 then
    startbar=barindex
    endif
    elsif myTimeframe=1 then
    if DayOfWeek<DayOfWeek[1] then
    hh = Highest[BarIndex – lastWeekBarIndex](High)[1]
    ll = Lowest[BarIndex – lastWeekBarIndex](Low)[1]
    lastWeekBarIndex = BarIndex
    startbar=barindex
    Endif
    elsif myTimeframe=2 then
    If MonthMonth[1] then
    hh = Highest[BarIndex – lastMonthBarIndex](High)[1]
    ll = Lowest[BarIndex – lastMonthBarIndex](Low)[1]
    lastMonthBarIndex = BarIndex
    startbar=barindex
    endif
    elsif myTimeframe=3 then //yearly myTimeframe
    if year>year[1] then
    hh = Highest[BarIndex – lastYearBarIndex](High)[1]
    ll = Lowest[BarIndex – lastYearBarIndex](Low)[1]
    lastYearBarIndex = BarIndex
    startbar=barindex
    endif
    endif

    //horizontal
    drawvline(startbar) coloured(0,0,255)
    drawsegment(startbar,ll,barindex,ll) coloured(0,0,255)
    drawsegment(startbar,hh,barindex,hh) coloured(0,0,255)
    midpoint=(hh+ll)/2
    drawsegment(startbar,midpoint,barindex,midpoint) coloured(0,0,255)
    quartile=(hh-ll)/4
    drawsegment(startbar,ll+quartile,barindex,ll+quartile) coloured(200,0,0)
    drawsegment(startbar,ll+quartile*3,barindex,ll+quartile*3) coloured(200,0,0)

    //angulars
    mid=quartile*2
    for i = 0 to 10 do
    drawline(startbar,ll+mid*i,barindex,hh+mid*i) coloured(0,191,255,alpha)
    drawline(startbar,ll-mid*i,barindex,hh-mid*i) coloured(0,191,255,alpha)
    drawline(startbar,hh-mid*i,barindex,ll-mid*i) coloured(0,191,255,alpha)
    drawline(startbar,hh+mid*i,barindex,ll+mid*i) coloured(0,191,255,alpha)
    next

    return

avatar
Register or

Likes

avatar avatar avatar avatar avatar avatar avatar avatar avatar avatar avatar
Related users ' posts
kats bONSOIR Est ce normal que les droites se démultiplient en plusieurs droites quelle differe...
kats j ai fait une copie d'ecran mais je ne sais pas comment l'envoyer sur le site
Iván Thanks ;)
kats BONJOUR je lai mis sur du renko , il est complexe car toujours a l'envers??? Peut être ne ...
RTR Great tool again and great job, thank you! So from what I see everytime Z-Score is over 0...
Gaspare Ciao Ivan si puo' inserire una strategia su questo indicatore per ottimizzare le variabil...
P. Marlowe Impressive work. Accurate, interesting, good background. You hit the nail on the head again....
Iván Hi! You should change $rbox, $gbox and $bbox variables. Also r,g,b for last box.
finplus Thanks Ivan.
roccafragius Ivan, I just want to say you.. very very great job!!!! Thank you so much for this indicator!...
Iván
2 weeks ago
groelandes Cuando te descargas el fichero itf, en su código no aparece toda la configuración de alertas...
Iván Si lo descargas e importas en tu PRT verás que se han creado las variables para luego config...
Iván
3 weeks ago
Danger Zones Indicator
2
Indicators
P. Marlowe Quite an impressive work, as usual. You share extremely useful tools and show an stunning ba...
Iván Thank you very much!
P. Marlowe Quite an impressive work, Iván. Extremely useful and accurate. Congratulations. Keep it up¡
lkiklkik i love it !!! thanks.
Stenozar Hi Ivan, can you translate from tradingviwe the EMA TREND METER INDICATOR? It couid be inte...
Iván Hi Yes I can. Please, create a new topic for that I will translate it.
Stenozar Hi Ivan, I've created a new topic about the indicator: https://www.prorealcode.com/topic/ema...
Iván sería así //------------------Inputs------------------------------ linreglength = 11//i...
Doddge Muchísimas gracias Iván, está genial.
superfalcio holaaa, have you run some statistics?
Doddge Hola Iván, ¿sería posible crear un screener que indique cuándo las velas coloreadas del indi...
RTR Ivan thank you for the pro-screener. I a trying to understand how to write the signals from ...
Iván Hi, Lines 62 and 63. These lines define buy and sell conditions.
el titi Bonjour, merci beaucoup pour ce partage. Je vais regarder avec attention ce script et analys...
Armand2020 Bonjour , super taf!! serait il possible de faire un poc dynamique en timeframe 5 min en mod...
philippe59139 voici ce qu'il faudrait faire ou ajouter: //poc dynamique defparam calculateonlastbars=1...
Iván
2 months ago
Iván I personally like it in daily timeframe
oliTR Many thanks Ivan, I copy/paste your code to try it but could only get a constant stable unif...
Iván Hi, I've copied the code above and it works... what asset are you trying? $indices array ...
francis59 Hello Ivan, thanks for this very nice and powerfull indicator. Could you have time to create...
Iván Hi We could find stocks with sweep on: //PRC_Sweep Institucional //version = 0 //28.0...
inverse Like the way you think Ivan ... :)
Iván Hi You should delete from the indicator code all drawing functions and all variables not us...
Iván I've created a screener to show [longcondition or shortcondition]
Chrisinobi Hallo Ivan, Danke das ist Perfekt !! Kannst du bitte in der Screener-Bibliothek die itf. hoc...
Gio56 Super idée. j'ai juste un souci. j'ai pas de barre verte mais plusieurs lignes de couleurs.....
DeathMetal change line in histgram, (click on indicator name, click on tool (
Gio56 Super merci.

Top