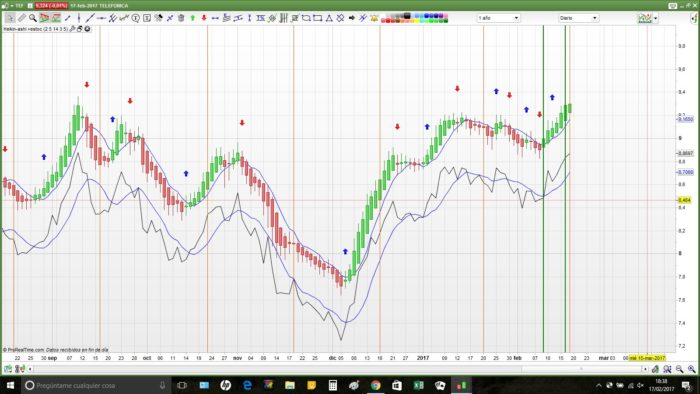
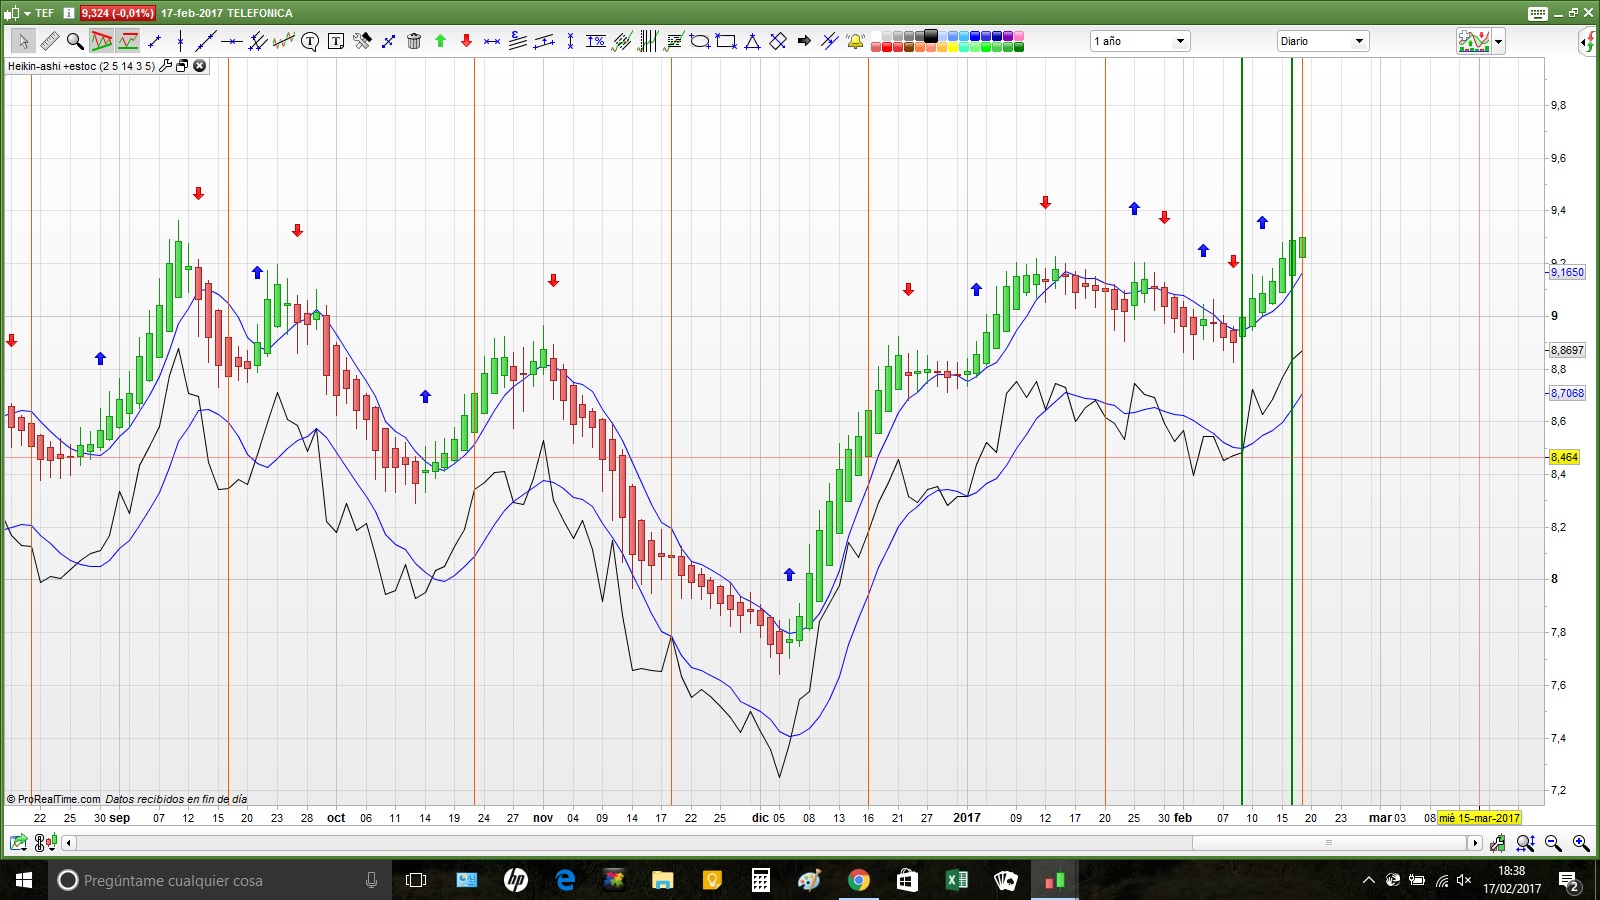
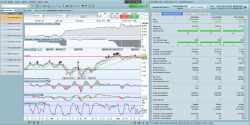
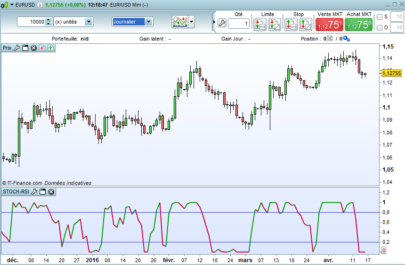
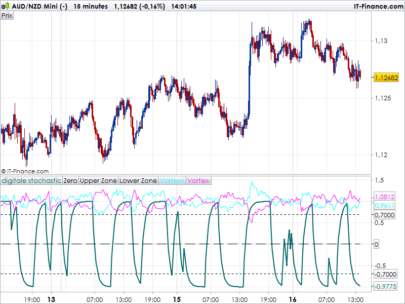
Second version of my previous heikin-ashi with stochastic including drawing a vertical orange line on every 3rd Friday of the month, which signals the end of options/warrants, due to the impact it has on closing values.
Rules in Heikin-Ashi:
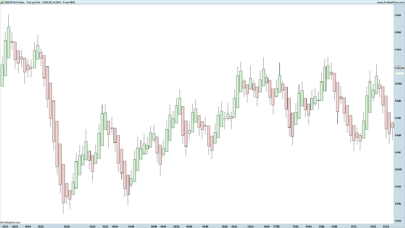
1- White body sequence = upward trend.
Sequence of black bodies = downtrend.
2- Strong bullish trend = Large white bodies and no lower shadows.
Strong bearish trend = Large black bodies without upper shadows.
3- When the tendency weakens small bodies appear with possible upper and / or lower shadows.
4- A consolidation occurs when small bodies appear with both shadows both above and below.
5- The reversal of a trend can be suspected with the appearance of small bodies with both upper and lower long shadows, or a sudden change of color
|
1 2 3 4 5 6 7 8 9 10 11 12 13 14 15 16 17 18 19 20 21 22 23 24 25 26 27 28 29 30 31 32 33 34 35 36 37 38 39 40 41 42 43 44 45 46 47 48 49 50 51 52 53 54 55 56 57 58 59 60 61 62 63 64 65 66 67 68 69 70 71 72 73 74 75 76 77 78 79 80 81 82 83 84 85 86 87 88 89 90 91 92 93 94 |
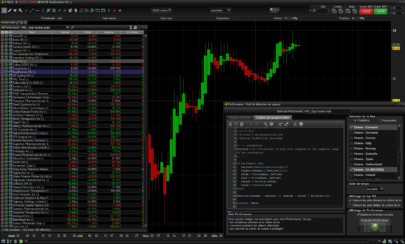
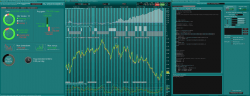
//Reglas en Heikin-Ashi: //1- Secuencia de cuerpos blancos = tendencia alcista. // Secuencia de cuerpos negros = tendencia bajista. //2- Tendencia alcista fuerte = Grandes cuerpos blancos y sin sombras inferiores. // Tendencia bajista fuerte = Grandes cuerpos negros sin sombras superiores. //3- Cuando la tendencia se debilita surgen cuerpos pequeños con posibles sombras superior y/o inferior. //4- Una consolidación se da cuando aparecen cuerpos pequeños con ambas sombras tanto arriba como abajo. //5- La reversión de una tendencia se puede sospechar con la aparición de pequeños cuerpos con sombras largas tanto superiores como inferiores, o un cambio repentino de color. // parámetros //ONCE SmoothPeriod=2 valor por defecto //ONCE period=5 valor por defecto //ONCE Kperiod=5 valor por defecto //ONCE Kspeed=2 valor por defecto //ONCE Dperiod=5 valor por defecto ONCE flecha=0 ONCE Dflech=barindex // ciclo normal IF BarIndex=0 THEN xClose = (open+high+low+close)/4 xOpen = open xHigh = high xLow = low ELSE xClose = (open+high+low+close)/4 xOpen = (xOpen[1]+xClose[1])/2 xHigh = Max(max(high, xOpen), xClose) xLow = Min(min(Low, xOpen), xClose) ENDIF // SUAVIZADO con la media de 2 en las velas IF barindex>=(period+SmoothPeriod) THEN AvOpen=exponentialAverage[SmoothPeriod](xOpen) AvHigh=exponentialAverage[SmoothPeriod](xHigh) AvLow=exponentialAverage[SmoothPeriod](xLow) AvClose=exponentialAverage[SmoothPeriod](xClose) ENDIF // y ésta es la que uso DRAWCANDLE(AvOpen, AvHigh, AvLow, AvClose) //ha7 para indicar cruces // los valores para barindex<2 son especiales IF Barindex < SmoothPeriod then Opcl=Open[1] ELSE Opcl=Open ENDIF // calculo dos medias de 7 y de 10 Media7 = Average[7](Opcl) rango= Media7/10 // uso rango para el dibujo Alcista = AvOpen<AvClose Alcista1 = AvOpen[1]<AvClose[1] Bajista = AvOpen>AvClose Bajista1 = AvOpen[1]>AvClose[1] // //ahora calculo el Estocástico LineaK=100*((close-lowest[Kperiod](low))/(highest[Kperiod](high)-lowest[Kperiod](low))) K=exponentialaverage[Kspeed](LineaK) D=exponentialaverage[Dperiod](K) //valor representa mi compra cuando estoy dentro // y el precio de venta cuando me salgo //no puede haber dos operaciones en dos dias // IF Dflech < barindex[2] then //IF (Opcl>Media7 or CruceOVayer or CruceOVhoy) and not (Bajista and Bajista1) and flecha<1 and K>D THEN IF flecha<1 THEN IF K>D THEN IF (Opcl>Media7 or Bajista1) THEN IF Alcista THEN DRAWARROWUP (barindex, AvHigh+rango/4) COLOURED (0, 0, 255) flecha=1 Dflech = barindex valor = AvClose //IF (Opcl<Media7 or CruceUNayer or CruceUNhoy) and not (Alcista and Alcista1) and flecha>=1 and K>D THEN ENDIF ENDIF ENDIF ELSIF flecha>=1 THEN IF K<D THEN IF (Opcl<Media7 or Alcista1) THEN IF Bajista THEN DRAWARROWDOWN (barindex, AvHigh+rango/4) COLOURED (255, 0, 0) flecha=-1 Dflech = barindex valor = AvClose ENDIF ENDIF ENDIF ENDIF ENDIF // dibuja líneas en el tercer viernes de cada mes If Dayofweek =5 and day>= 15 and Day<=21 then DRAWVLINE(barindex) coloured(237,96,9) endif RETURN Media7 COLOURED (0,0,255) AS "M7", K/100 AS "K", D/100 as "D", Bajista as "Baj", Alcista as "Alc",valor COLOURED (255,0,0) as "valor", Opcl-rango*0.5 COLOURED(0,0,0) as "Opcl-Rgo", Media7-rango*0.5 coloured (0,0,255) as "M7-Rgo" |
Share this
No information on this site is investment advice or a solicitation to buy or sell any financial instrument. Past performance is not indicative of future results. Trading may expose you to risk of loss greater than your deposits and is only suitable for experienced investors who have sufficient financial means to bear such risk.
ProRealTime ITF files and other attachments :
Find other exclusive trading pro-tools on ![]()
PRC is also on YouTube, subscribe to our channel for exclusive content and tutorials


Hola Rafa,
gracias por el gran trabajo!
Muy interesante.
Hay algunos puntos que no me quedan claros, hay alguna documentacion adicional que pueda leer?
Muchas gracias.
Un saludo.
Hola Diego.
Me imagino que te refieres a la documentación del Heikin-Ashi. Hay montones de artículos que describen el funcionamiento.
En cualquier caso, no dudes en preguntarme lo que no entiendas y, si puedo, te lo aclaro.
En cuanto al “indicador” es, como verás, una mezcla de Heikin-ashi y del estocástico.
Un cordial saludo.
Diego:
hay un libro de José Luís Cárpatos titulado “Leones contra Gacelas” que habla de este indicador así como de otros muchos. No baja al detalle, pero vale para descubrir un poco la filosofía que subyace detrás.
Te paso varios enlaces que te pueden ayudar.
https://www.xtb.com/es/heikin-ashi-conceptos-basicos-y-operativa-de-trading-con-este-tipo-de-velas-modificadas-kb
http://www.finanzas.com/noticias/mercados/bolsas/20140616/heikin-ashi-conceptos-basicos-2692751.html
http://www.novatostradingclub.com/analisis-tecnico/velas-heiken-ashi/ éste es anti heikin ashi
http://www.estrategiasdeinversion.com/invertir-corto/experto/analisis-tecnico-atresmedia-velas-heikin-ashi-313628 éste es un buen ejemplo.
También encontrarás en Rankia, IG, etc.
Lo que está claro es que siempre que “suavizas” las curvas , eliminas ruido, pero pierdes flexibilidad. No puedes aplicar los patrones de velas, porque los precios están modificados. Pero para trabajar con tendencias a medio plazo, a mí me parecen bastante válidas. Y si las aplicas a escala semanal en vez de a diaria, verás como confirman muchas cosas. Mi sugerencia es que se usen como un indicador más que aporta información válida pero no es la panacea y que no se debería invertir sólo en base a este indicados.
El añadirle el estocástico, persigue darle cierta agilidad ya que éste si que es rápido detectando cambios.
Las curvas que te dibuja debajo, están desplazadas por claridad de gráficos, que si no, te dejas los ojos. Usa los canales y los dojis como figuras a identificar.
Mi experiencia es que, a veces, cuando el cuerpo te pide salirte o entrar, te ayuda a posponer y mejorar la decisión. Y sobre todo lo hace menos sensible a la triple hora bruja del tercer viernes de cada mes.
Espero que te ayude y disculpa el retraso, pero he estado liado y no he podido contestarte antes.
Un cordial saludo.
Hello can please tell me how to install the indicator correct. After upload j don’t get the same result as above,HA candle are very small and on one line?
Set the vertical axis to use the price only (in price settings).
Thanks Nicolas it helps,,,but what are the settings of variable? After upload the code and use price setting j dont get arrow and stochastic. Thanks for the help,,j just run PRT for a few weeks now so nead to learn a lot
Nicolas is right. You have to set up thevertical axis. When you install and run the indicator, if you modify it you may access to variables defined. Even so, in the screen you may modify them for this specific screen. In the indicator, you have as remarks the value used (at the begining). You may identify also by the sentence ONCE.
If still have doubts, pkease let me know.
Regards.
Hi Rafa,
Is it possible for you to translate this code to pinescript (tradingview) i would like to back test it. It looks really interesting
Bonjour il existe l’indicateur Heikin Ashi smoothed with signals sur ce lien
https://www.prorealcode.com/prorealtime-indicators/heikin-ashi-smoothed-signals/
avec ce le screener ici https://www.prorealcode.com/topic/sreener-per-heikin-ashi-smooth-and-signals/
Je souhaiterais avoir le screener de cet indicateur qui lui ressemble et qui est plus précis :
Heikin Ashi lissé avec signaux stochastiques
avec le lien ici
quelqu’un pourrait il m’aider
Merci
https://www.prorealcode.com/prorealtime-indicators/smoothed-heikin-ashi-stochastic/
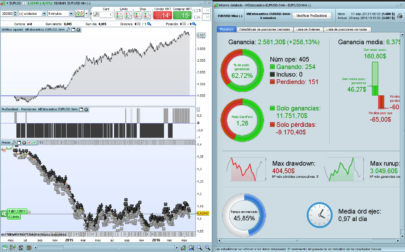
Ca est la second version. Quand le marché est plain la première version produit beaucoup de signaux. la difficulté pour ca est la fixation de le paramètre margen qui est particulière pour chaque valeur
Bonsoir
Qu’appelez vous l’axe vertical et comment le définir ? Merci pour votre aide.
Je viens de voir ce que vous voulez dire. Comme pour tout autre indicateur, vous devez définir la plage d’affichage, en utilisant la souris de l’ordinateur. Si vous ne le faites pas, les lignes peuvent être rapprochées et ne pas être visibles. C’est la même chose qu’avec le volume ou le prix.
Pardonnez-moi mais je ne sais pas ce que vous entendez par “axe vertical”. Serait-ce la ligne verticale qui reflète le troisième vendredi de chaque mois (en raison de l’expiration des contrats à terme et des options) ?. c’est automatique et ne constitue qu’un avertissement car ce jour-là, les mouvements du marché boursier sont influencés par l’expiration de ces options. Salut