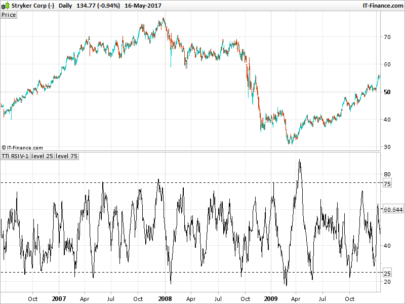
With the RSI Reverse Engineering indicator, you are able to calculate the price of the next candle on a certain value of the RSI. E.g. what price is needed for the RSI to be at 70 on the next candle.
|
1 2 3 4 5 6 7 8 9 10 11 12 13 14 15 16 17 18 19 20 21 22 23 24 25 26 27 28 29 30 31 |
REM Reverse Engineering RSI, original by Giorgos Siligardos REM Build for ProRealTime, used RSI with WilderAverage REM Parameters RSIRevValue = 70 RSIPeriod = 14 REM Original RSI values RSIOri = RSI[RSIPeriod](close) UPOri = MAX(0, close - close[1]) //higher close then previous DOWNOri = MAX(0, close[1] - close) //lower close then previous upMAOri = wilderAverage[RSIPeriod](UPOri) downMAOri = wilderAverage[RSIPeriod](DOWNOri) REM Reversed Engineered RSI Value to Price RSRev = (100/((-1*RSIRevValue)+100))-1 if RSIRevValue < RSIOri THEN upMARev = upMAOri*(1-(1/RSIPeriod)) downMARev = upMARev/RSRev DOWNRev = (downMARev - (downMAOri * (1-(1/RSIPeriod))))/(1/RSIPeriod) RSIPriceRev = close - DOWNRev elsif RSIRevValue > RSIOri THEN downMARev = downMAOri*(1-(1/RSIPeriod)) upMARev = downMARev*RSRev UPRev = (upMARev - (upMAOri * (1-(1/RSIPeriod))))/(1/RSIPeriod) RSIPriceRev = close + UPRev endif RETURN RSIPriceRev as "RSIPriceRev" |
Share this
No information on this site is investment advice or a solicitation to buy or sell any financial instrument. Past performance is not indicative of future results. Trading may expose you to risk of loss greater than your deposits and is only suitable for experienced investors who have sufficient financial means to bear such risk.
ProRealTime ITF files and other attachments :
Find other exclusive trading pro-tools on ![]()
PRC is also on YouTube, subscribe to our channel for exclusive content and tutorials


Thank you Louis. I just download,
Which system do you recommend ?
Hi Matt, there is not a specific system. For traders using the RSI in their setup, with this indicator they can see which share price is needed on the next bar to achieve a certain value RSI value. Let’s say the RSI(x) is currently on 76, and you want to know the share price the next bar if the RSI would touch the 80 line. The indicator gives you the needed share price.
Hi Louis! This indicator has helped me a lot, has tried to get the RSI 30 extracted in the graph without success. Can you help me?
Hi Kosuda76, have you downloaded the rsi_revengineering.itf file? Then you can set any value you want. (The example code above contains hard coded 70 and 14 values)
Thanks for your reply! But I do not really understand what the opposite of them the values you entered. ;-(
Good job Louis!! How could do this for the Williams indicator? Thank you very much.
Hi!, Nice code.
I’m tryng to port it to another language, but I don’t understand this part:
upMAOri = wilderAverage[RSIPeriod](UPOri)
downMAOri = wilderAverage[RSIPeriod](DOWNOri)
UpOri and DOWNOri seems to be prices (float) but wilderAverage function expects a collection of prices, right? can you explain?
Thanks!,
Ignacio