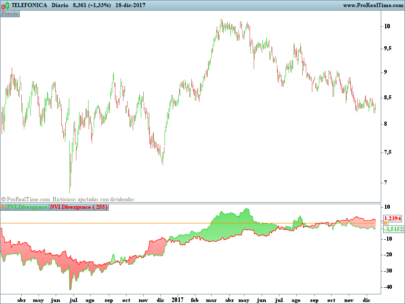
After a long work, I finally developed a simple, but useful RSI Divergences Indicator -Hey! another one?-
Yes, another one! (but I hope it is better than the default ProRealTime RSI Divergences Indicator).
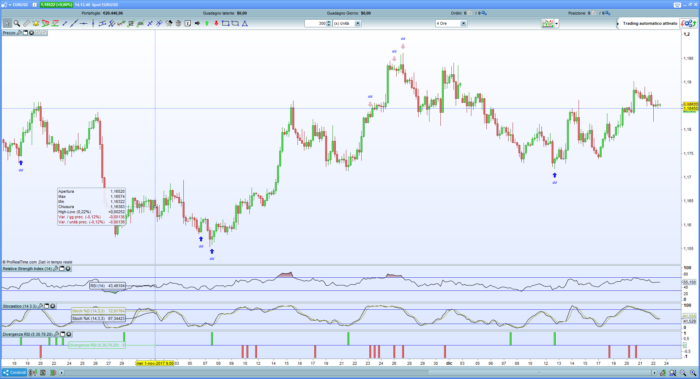
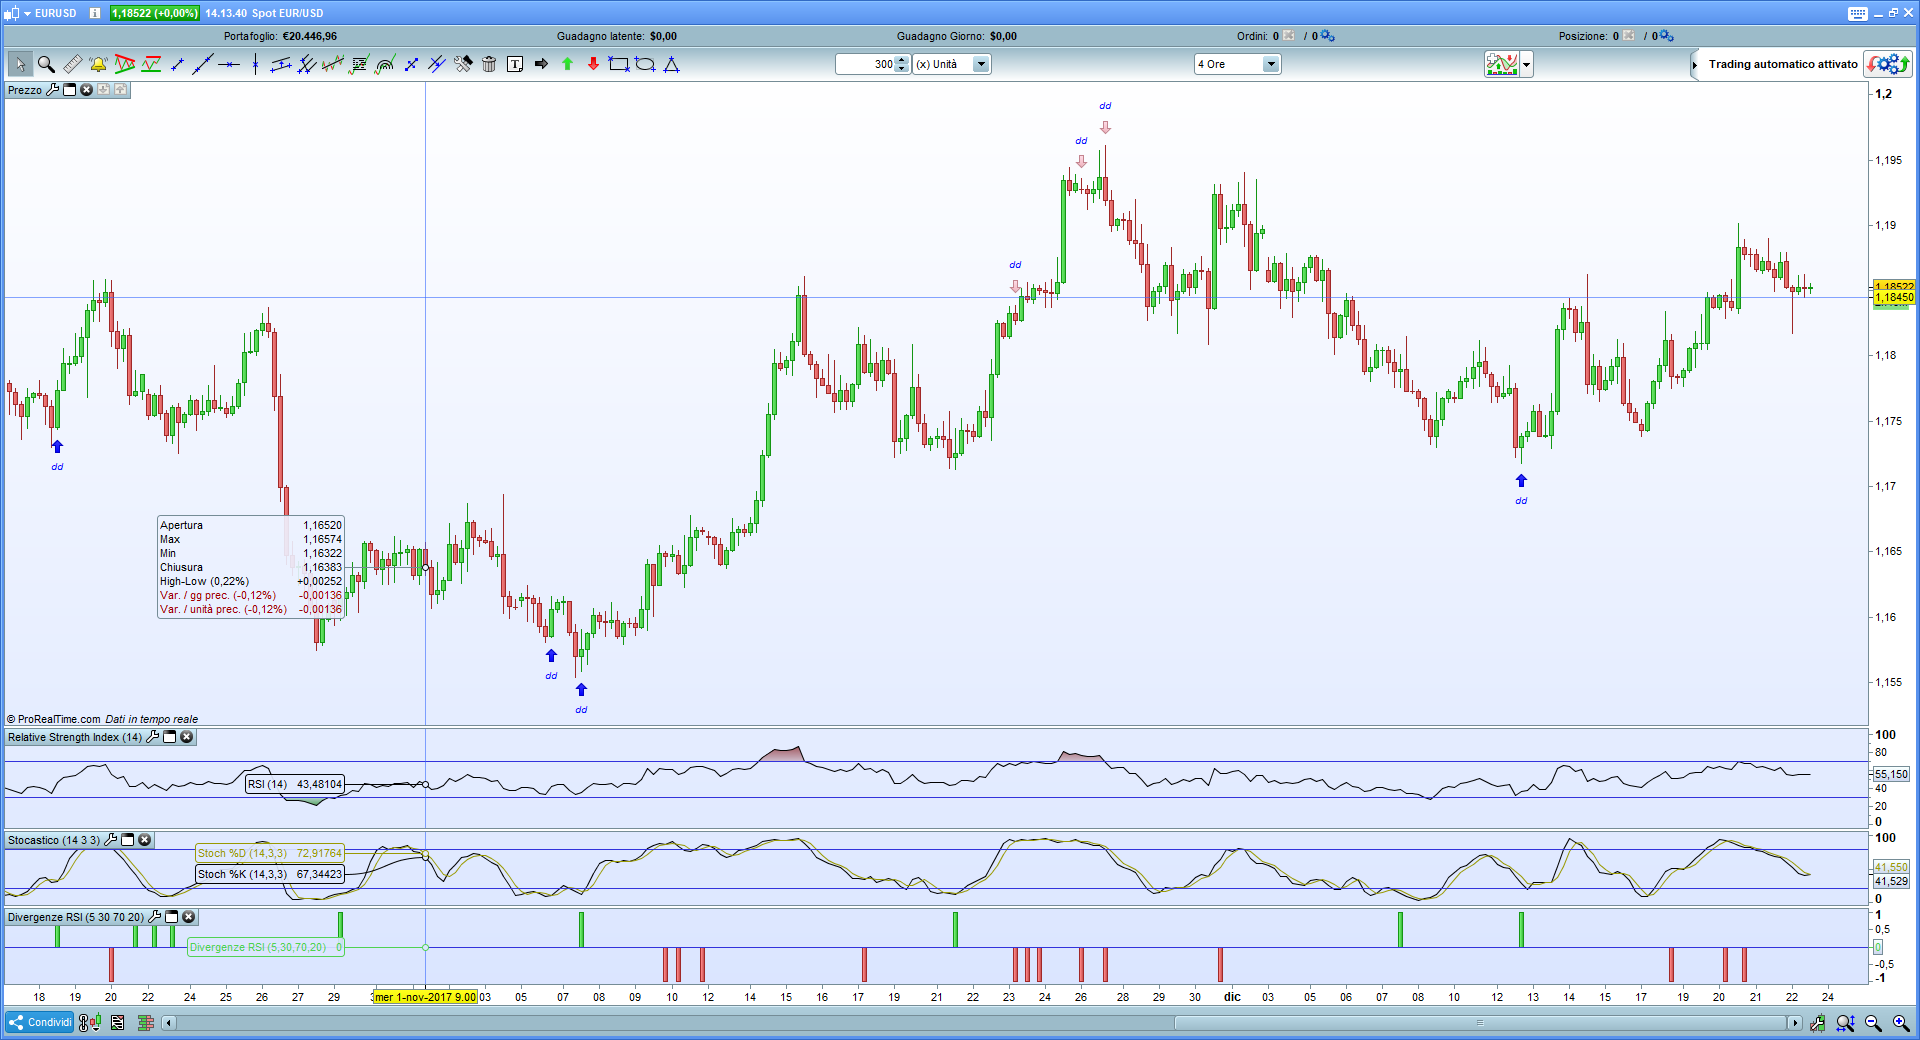
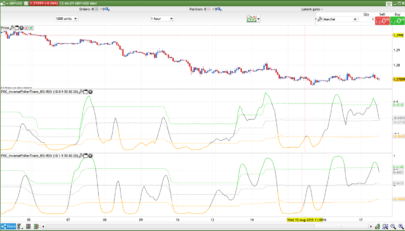
This indicator finds both Direct (or Regular) and Hidden (or Inverse) RSI Divergences.
When a divergence is found, an Arrow is drawn to the chart and a text is added to the Arrow to mark the type of Divergence: “dd” = Direct Divergence; “hd” = Hidden Divergence
Indicator parameters:
- RsiPeriod: number of bars to calculate RSI value, Default=10
- RsiOverSold: Oversold Level, Default=30
- RsiOverBought: OverBought Level, Default=70
- MinBarRange: minimum distance from two consecutive RSI Highs or RSI Lows, Default=3
Comparing my indicator with ProRealTime RSI Divergence Indicator (using same parameters values), i found that entry points are exactly the same, except for new arrows added by my indicator in case of hidden divergence. That’s why ProRealTime indicator shows only regular divergences.
You can play with parameters to change sensivity.
Briefly, an RSI Divergence screener will be follow.
Merry Christmas!
Ciao!
|
1 2 3 4 5 6 7 8 9 10 11 12 13 14 15 16 17 18 19 20 21 22 23 24 25 26 27 28 29 30 31 32 33 34 35 36 37 38 39 40 41 42 43 44 45 46 47 48 49 50 51 52 53 54 55 56 57 58 59 60 61 62 |
//RSI Divergences By Frank (Francesco) //Description: the indicator draws arrows on chart as entry points when a direct or an hidden RSI divergence is found. //When a DIRECT divergence is found, "dd" (direct divergence) text is added to chart over (Sell signal) or under (Buy signal) the arrow //When an HIDDEN or INVERSE divergence is found, "hd" (hidden divergence) text is added to chart over (Sell signal) or under (Buy signal) the arrow //Variables: //RsiPeriod: number of bars to calculare RSI value //RsiOverSold: Oversold Level //RsiOverBought: OverBought Level //MinBarRange: minimum distance from two consecutive RSI Highs or RSI Lows Rge = averagetruerange[10](close) MyRSI = rsi[RsiPeriod](Close) ONCE ShiftText = 3 RsiMax = MyRSI < MyRSI[1] and MyRSI[1] > MyRSI[2] and MyRSI[1] > RsiOverBought RsiMin = MyRSI > MyRSI[1] and MyRSI[1] < MyRSI[2] and MyRSI[1] < RsiOverSold if RsiMax then RSIMax1 = MyRSI[1] High1 = High[1] for I = MinBarRange to 80 if RsiMax[I] then RSIMax2 = MyRSI[I + 1] High2 = High[I + 1] If High1 > High2 and RSIMax1 < RSIMax2 then DRAWARROWDOWN(barindex, High + Rge / ShiftText)coloured(255,192,203,255) DRAWTEXT("dd", barindex, High + Rge / ShiftText / 0.3,SansSerif,Italic,10)coloured(0,0,255,255) elsif High1 < High2 and RSIMax1 > RSIMax2 then DRAWARROWDOWN(barindex, High + Rge / ShiftText)coloured(255,192,203,255) DRAWTEXT("hd", barindex, High + Rge / ShiftText / 0.2,SansSerif,Italic,10)coloured(0,0,255,255) endif break endif next endif if RsiMin then RSIMin1 = MyRSI[1] Low1 = Low[1] for I = MinBarRange to 80 if RSIMin[I] then RSIMin2 = MyRSI[I + 1] Low2 = Low[I + 1] If Low1 < Low2 and RSIMin1 > RSIMin2 then DRAWARROWUP(barindex, lOW - Rge / ShiftText)coloured(0,0,255,255) DRAWTEXT("dd", barindex, lOW - Rge / ShiftText / 0.3,SansSerif,Italic,10)coloured(0,0,255,255) elsif Low1 > Low2 and RSIMin1 < RSIMin2 then DRAWARROWUP(barindex, lOW - Rge / ShiftText)coloured(0,0,255,255) DRAWTEXT("hd", barindex, lOW - Rge / ShiftText / 0.2,SansSerif,Italic,10)coloured(0,0,255,255) endif break endif next endif return |
Share this
No information on this site is investment advice or a solicitation to buy or sell any financial instrument. Past performance is not indicative of future results. Trading may expose you to risk of loss greater than your deposits and is only suitable for experienced investors who have sufficient financial means to bear such risk.
ProRealTime ITF files and other attachments :
Find other exclusive trading pro-tools on ![]()
PRC is also on YouTube, subscribe to our channel for exclusive content and tutorials


Grazie !
Prego, spero che funzioni. Ho postato (due volte) anche lo screener, ma non l’ho visto ancora pubblicato.
Grazie francesco per questo lavoro !!!
Ciao Francesco, oltre alle istruzioni grafiche (DRAWARROWUP e DOWN / DRAWTEXT) che hai inserito nel codice avrei voluto inserire DRAWSEGMENT che funziona nel tempo, purché non venga rilevata un’altra divergenza !!! Hai qualche idea su come fare questo ???
Ho provato ad inserire i segmenti per evidenziare le divergenze, ma al momento non sono riuscito ad individuare correttamente i punti, per cui i segmenti stessi mi venivano disegnati nei punti e con le inclinazioni sbagliate. Cmq, per disegnarli devi individuare i punti (x1, y1) e (x2, y2) che sono le coordinate dei due punti estremi del segmento. x1 dovrebbe essere la candela (il barindex) del minimo (o massimo) più vecchio e y1 il relativo valore di RSI. Allo stesso modo, x2 è la candela del secondo minimo (o massimo) più recente e y2 il relativo valore di RSI.
In effetti i rispettivi valori di RSI (cioè y1 e y2) possono essere letti dalle variabili RSIMax1 e RSIMax2 (nel caso dei massimi); RSIMIn1 RSIMin2 nela caso dei minimi. x1 e x2 andrebbero letti dalla variabile “I” che rappresenta il barindex man mano che il ciclo for –> next viene scorso. Ci ho provato, ma le riche mi venivano disegnate tutte storte. Ci devo lavorare.
Hello merci pour l’indicateur
j’ai un message d’erreur
Veuillez définir la variable suivante : rsipériod
Veuillez définir la variable suivante :rsioverbought
Veuillez définir la variable suivante :rsioversold
Veuillez définir la variable suivante : minbarrange
quel sont ces données et ou dois je les mettre?
merci par avance
J’ai trouvé pour rajouter les variables…
thanx for indicator
Very nice Franceso. Like it.
Q: to turn your indicator into a strategy, shall I just replace lines Drawarrows and draw text with “Buy 1 contract at market” ?
Sorry still learning 🙁 cause I’ve tried of course and it doesn’t work…Do not laught 😉
@Inertia: yes, you have to replace Drawarrow and Drawtext with Buy or Sell orders.
I am new to prorealtime and when I add this is wants to put it in a lower frame how do I get it to show up on my chart frame. Thanks for your help
1- Download attached file rsi-divergences-2.itf
2- Here is how to import indicator into your platform:
https://www.prorealcode.com/import-export-prorealtime-code-platform/
3- Here is how to add indicator to your chart
https://www.prorealtime.com/en/help-manual/technical-analysis-indicators
Here is how to show it on your char
Ciao Francesco!
Grazie per l’indicatore che da tanto stavo cercando inutilmente di provare a creare! Ho un paio di domande da farti…
L’ATR che hai inserito all’inizio serve a? 🙂 non credo abbia a che fare con lo strumento…penso che serva a disegnare qualcosa sul grafico…esatto?
Cosa intendi con shiftext?
Valore 3? Sono il numero di barre che considera per verificare se c’è o no la divergenza?
Pensavo che quell’istruzione fosse data dal minbarrange……
Confusion….;(
Mi dai una mano?:)
Grazie mille di tutto!!!
ShiftText serve semplicemente a far sì che il testo e la freccia non si sovrapoongano. Come avevi capito da solo, l’ATR serve solo a calcolare l’ordinata del punto sul quale piazzare la freccia sul grafico.
Grazie! Buona giornata
Ciao Francesco! Ti disturbo ancora per chiederti se conosci o se eventualmente pensi si possa generare un comando di buy o sell all’incrocio di 2 MM, ma dopo che si verifichi una divergenza sul tuo indicatore rsi…magari se ci fosse la possibilità anche di stabilire dopo quante barre dalla divergenza il segnale possa definirsi valido…per esempio mi scatta la divergenza e se entro max 5 barre si incrociano le mm ok…se no non prendere l’ordine….la vedo dura:)
Grazie caro
P.s. ho provato a togliere le divergenze nascoste (hd) dall’indicatore, ma nonostante inserisca gli stessi parametri, non mi da gli stessi segnali che mi da invece l’indicatore di divergenze rsi quello standard della piattaforma…
Salve ho notato che questo indicatore non mi funziona importandolo correttamente. Idee?
Hello Francesco, Is there any parameters that you recommend for lower or higher TF please
Thank You Grazie Mile
Hi,
When I download this it says RSI Divergences 1 itf, not 2?
There are no Return values and it’a a blank indicator?
Any ideas anyone?
Hi Francesco
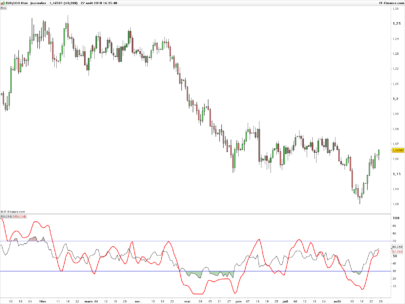
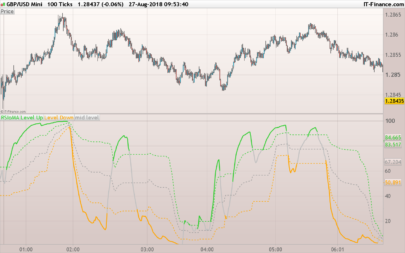
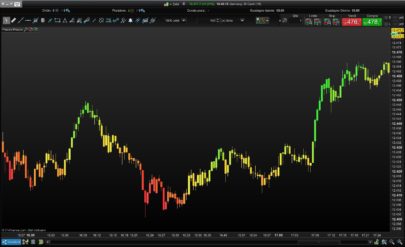
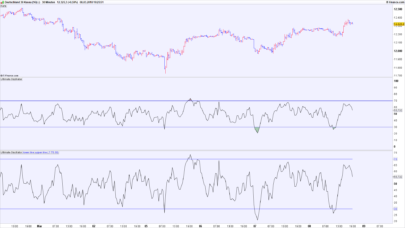
I appreciate you uploaded this a long time ago but it is a useful indicator if you can’t spot the divergences manually. Interestingly I’ve compared it on IG Index spreadbet chart data and ProRealTime real market data and it highlights more interesting divergences on the real data which I guess is not a surprise. I’ve uploaded an image that compares a 5 min chart and you can see the differences. Thought you or someone else might be interested.
Cheers
Rob
https://drive.google.com/file/d/1-AQ4AS7LGV6hDJGUmKELNkHb_HZwuJ1_/view?usp=sharing
Try this link, it actually works.
https://drive.google.com/file/d/1-EZBYlTi8qWOYT4_ZxgTlE0aUcnfKF6t/view?usp=sharing
How to install in META 4 ?
Our website is about programming for ProRealTime trading platform and not about Metatrader4!
https://trading.prorealtime.com/en/
Hello Francesco,
I have the same problem as Bard, a blank indicator without any return value.
Coul you help me please ?
Many thanks
Nice
bonjour,
merci pour cet indicateur très utile –
Pouvez expliquer pourquoi l’indicateur apparaît dessous/dessus le chandelier lorsque la divergence est détectée sur les ut intraday alors qu’il apparaît le lendemain en ut journalière.
j’ai testé les différents paramètres et je n’arrive pas à résoudre ce problème.
merci pour vos retours.
Ludovic
Bonjour.
je viens de telecharger cet indicateur .Malheureusement il ne fonctionne pas ou plus !?
J’ai essayer deux fois sans succès . il s’affiche correctement mais aucune courbe ne s’affiche !!
Quelqu’un aurait-il rencontrer le même problème que moi?.
merci d’avance pour vos retours.
Hi Francesco,
Great Indicator and thanks for sharing.
How exactly does the MinRangeBar setting work? It sounds self explanatory but if i change from min 5 to min 3 some signals disappear – I would’ve thought that more would appear with the min bar range down. Is it based on the price or RSI?
Regards,
Geoff
Hi there,
I have V11.1.
I get the Indicator but no Arrows on the price.
Kind Regards
Michael
Ciao Francesco, sei ancora in giro?
This indicator is great but can someone create strategy based on the same indicator it will be great. Thank you in advance and have a good and profitable week 🙂