
1. Introduction
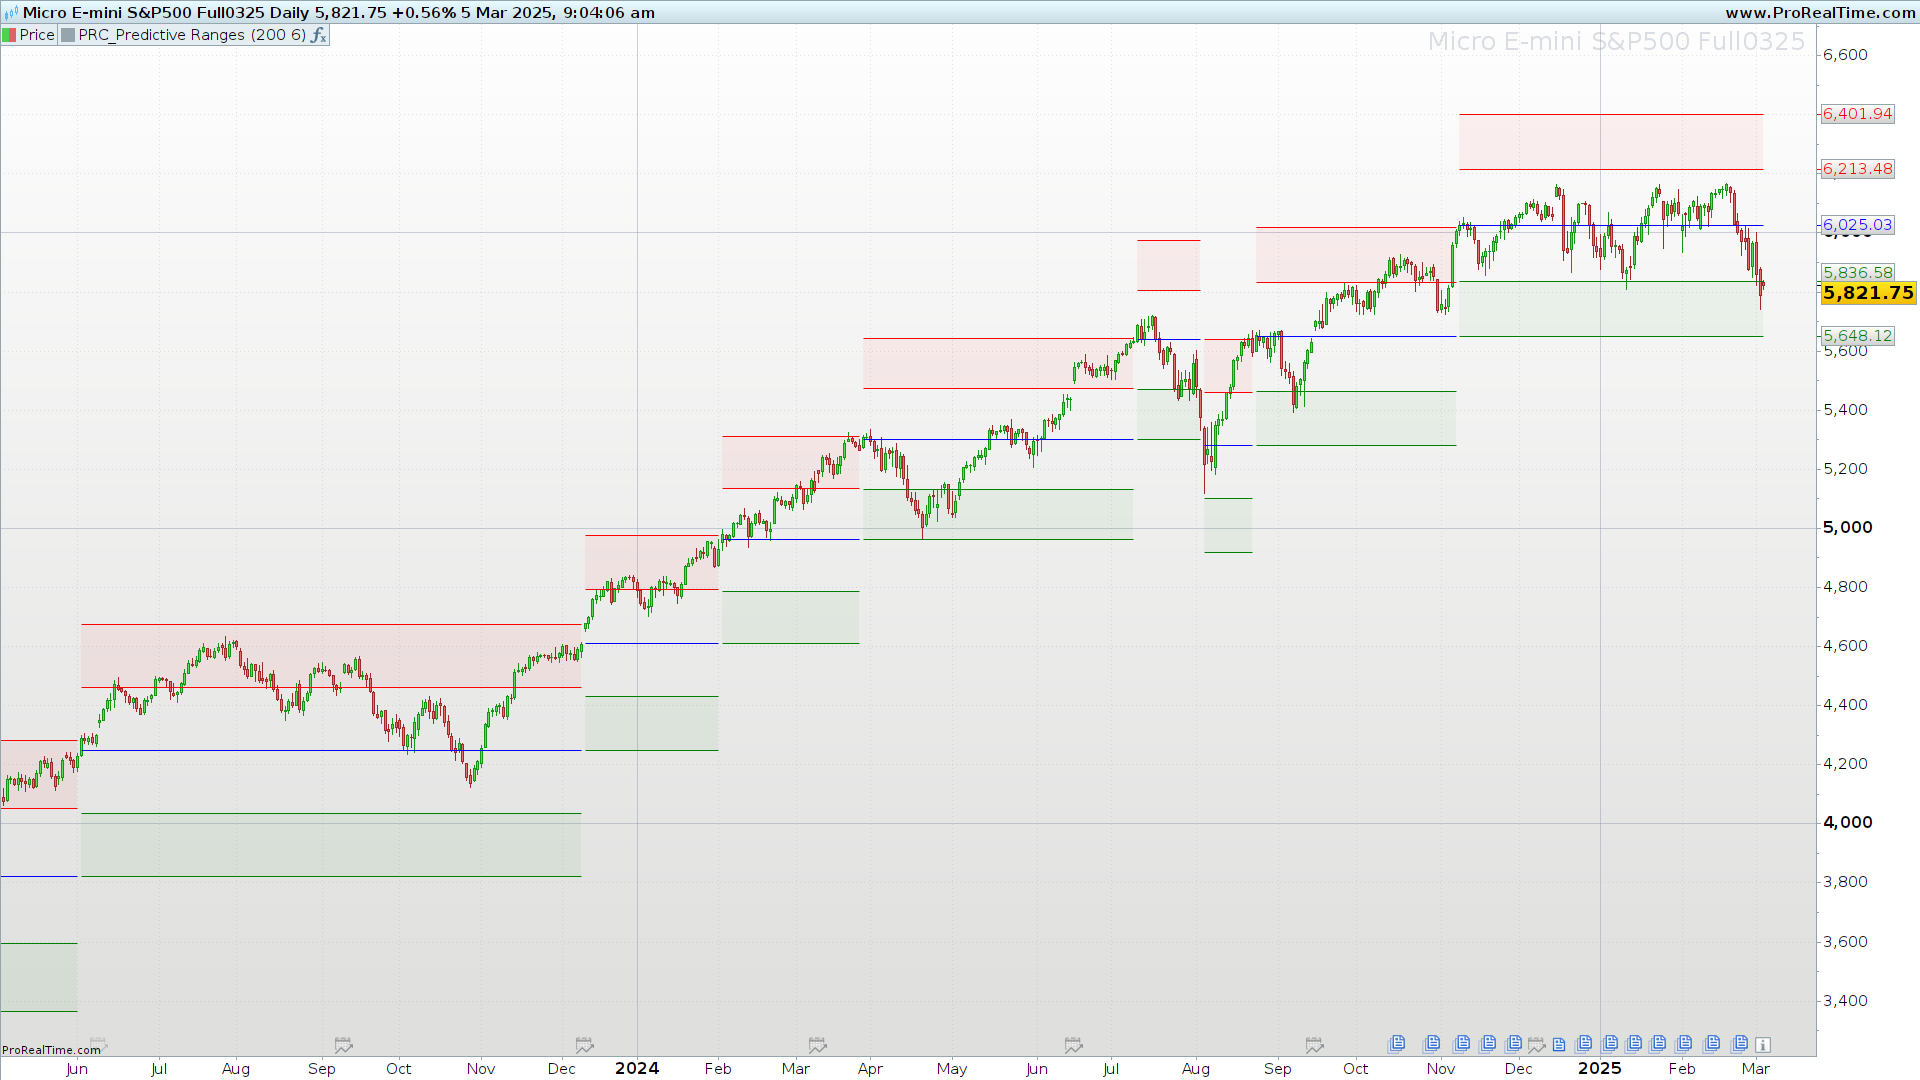
In technical analysis, identifying support and resistance zones is crucial for improving decision-making in financial markets. The Predictive Ranges indicator dynamically detects these levels based on market volatility and price behavior.
The Predictive Ranges is built using a price average and the Average True Range (ATR) to calculate support and resistance zones that adjust as market conditions change. This allows traders to visualize areas where the price might react, providing strategic entry and exit points.
In this article, we will explore how this indicator works, its practical applications in trading, and how to set it up in ProRealTime.
2. How Does the Predictive Ranges Indicator Work?
The Predictive Ranges indicator is based on the Average True Range (ATR) and a dynamic moving average to establish support and resistance levels that change depending on market volatility.
Calculation Process
-
Determine the Base Average
- The indicator calculates a moving average price using the closing price.
- This value serves as the reference point for determining support and resistance zones.
-
Calculate the Adjusted ATR
- The ATR is measured over a specified period (length).
- It is then multiplied by a custom factor (mult) to define the predictive range.
-
Adjust the Average Based on Price Behavior
- If the price rises above the average by more than the ATR, the average moves up.
- If the price drops below the average by more than the ATR, the average moves down.
- If there are no significant changes, the average remains stable.
-
Generate Predictive Range Levels
- The four key levels are calculated as follows:
- PRR2 (Second Resistance): Average + (Adjusted ATR * 2)
- PRR1 (First Resistance): Average + Adjusted ATR
- PRS1 (First Support): Average – Adjusted ATR
- PRS2 (Second Support): Average – (Adjusted ATR * 2)
- The four key levels are calculated as follows:
-
Opacity Management for Visualization
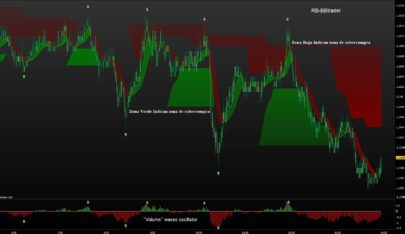
- The indicator applies dynamic transparency to highlight relevant support and resistance levels.
- When the average changes significantly, the opacity is low, indicating potential adjustments.
- When the average remains stable, opacity is high, making the levels more visible.
3. Trading Applications of the Predictive Ranges Indicator
The Predictive Ranges indicator is a versatile tool for multiple trading strategies. Its key advantage is the ability to dynamically adjust support and resistance levels based on market volatility.
3.1 Using Predictive Ranges as Dynamic Support and Resistance
The PRR2, PRR1, PRS1, and PRS2 levels serve as areas where price action is likely to react:
-
Buying and Selling Zones:
- PRR1 and PRR2 often act as resistances, where price may stall or reverse.
- PRS1 and PRS2 function as supports, where price may find demand.
-
Breakout Confirmation:
- A strong move above PRR2 may indicate a bullish continuation.
- A break below PRS2 could signal a bearish trend extension.
3.2 Integrating Predictive Ranges into Trading Strategies
-
Range Trading:
- When price oscillates between PRS1 and PRR1, traders can buy near support and sell near resistance.
- Can be combined with RSI or MACD for additional confirmation.
-
Breakout Trading:
- A candle closing beyond PRR2 or PRS2 suggests a potential breakout.
- Volume analysis can help confirm a breakout’s strength.
-
Multi-Timeframe Analysis:
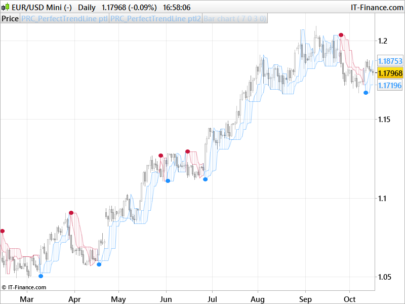
- Can be applied to daily charts for identifying long-term levels.
- Works well on intraday timeframes (5min-15min) for day traders and scalpers.
3.3 Identifying High-Volatility Periods
Since ATR is a key component, Predictive Ranges expands during high volatility and contracts in stable markets. This helps traders anticipate riskier periods and adjust strategies accordingly.
4. Configuring the Indicator in ProRealTime
To maximize its effectiveness, traders should understand the adjustable parameters in ProRealTime.
4.1 Key Customizable Parameters
-
ATR Length (length):
- Defines how many periods are used to calculate volatility.
- Higher values create smoother and more stable ranges.
- Lower values make the ranges more reactive to price movements.
- A default value of 200 is recommended, but can be adjusted between 50-500.
-
ATR Multiplier (mult):
- Controls the width of support and resistance zones.
- A higher multiplier (8-10) results in wider ranges, suitable for volatile assets.
- A lower multiplier (3-5) creates narrower zones, useful for stable markets.
- Default setting is 6, but can be adjusted as needed.
4.2 Adjusting Colors and Transparency
- Resistance Zone (PRR2 – PRR1): Red
- Support Zone (PRS1 – PRS2): Green
4.3 Recommended Timeframes for Different Trading Styles
| Trading Style | Recommended Timeframe | ATR Length | ATR Multiplier |
|---|---|---|---|
| Scalping | 1-5 min | 50-100 | 4-6 |
| Day Trading | 15-60 min | 100-200 | 5-8 |
| Swing Trading | 4H – Daily | 200-400 | 6-10 |
| Investing | Daily – Weekly | 400+ | 8-12 |
Testing different settings is recommended to find the best configuration for each asset and market condition.
5. Conclusion
The Predictive Ranges indicator is a powerful tool for identifying dynamic support and resistance zones based on market volatility. Its flexibility makes it suitable for scalping, day trading, and swing trading across various assets.
With its adjustable parameters, traders can customize the indicator in ProRealTime to match their specific trading style and market conditions.
📌 To start using Predictive Ranges, simply insert the code into ProBuilder and test different configurations to find the best setup for your strategy.
|
1 2 3 4 5 6 7 8 9 10 11 12 13 14 15 16 17 18 19 20 21 22 23 24 25 26 27 28 29 30 31 32 33 34 35 36 37 38 39 40 41 42 43 44 45 46 47 |
//--------------------------------------// //PRC_Predictive Ranges //version = 0 //13.02.2025 //Iván González @ www.prorealcode.com //Sharing ProRealTime knowledge //--------------------------------------// // inputs //--------------------------------------// length=200 // Length mult= 6 // Factor src=close //--------------------------------------// // Calculations //--------------------------------------// atr=averagetruerange[length](close)*mult once avg=src if src-avg > atr then avg=avg+atr elsif avg-src > atr then avg=avg-atr else avg=avg endif if avg<>avg[1] then holdAtr=atr/2 alpha=0 else holdAtr=holdAtr alpha=255 endif //--------------------------------------// // Supports and Resistances //--------------------------------------// prR2=avg+holdAtr*2 prR1=avg+holdAtr prS1=avg-holdAtr prS2=avg-holdAtr*2 //--------------------------------------// // Plot //--------------------------------------// colorbetween(prR2,prR1,"red",alpha*0.05) colorbetween(prS1,prS2,"green",alpha*0.05) //--------------------------------------// return avg coloured("blue",alpha),prR2 coloured("red",alpha),prR1 coloured("red",alpha),prS1 coloured("green",alpha),prS2 coloured("green",alpha) |
Share this
No information on this site is investment advice or a solicitation to buy or sell any financial instrument. Past performance is not indicative of future results. Trading may expose you to risk of loss greater than your deposits and is only suitable for experienced investors who have sufficient financial means to bear such risk.
ProRealTime ITF files and other attachments :
Find other exclusive trading pro-tools on ![]()
PRC is also on YouTube, subscribe to our channel for exclusive content and tutorials


Bravo à toi , c’est un super indicateur, très visuel est ce que tu as déjà un screener par exemple pour un départ de breakout sur PrR1ou prR2….? merci pour ton retour
Your indicator is quite good for me, thanks.
merci Ivan, super indicatuer. Les cours vont souvent toucher 50% des zones vertes ou rouges. est il possible de rajouter un trait pointillé sur ces 50%? Muchas gracias !!!!
Pour ajouter une ligne supplémentaire, il suffit de créer une nouvelle variable, par exemple:
prR3=avg+holdAtr*1.5
prS3=avg-holdAtr*1.5
excellent indicateur ! comment puis-je modifier le code pour afficher uniquement les derniers support et résistance ?