Pivot Bands

Pivot Bands

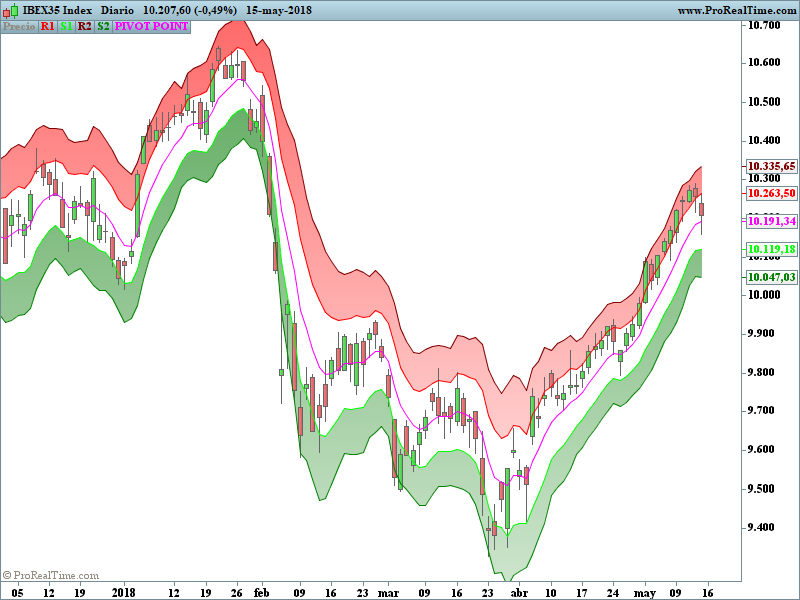
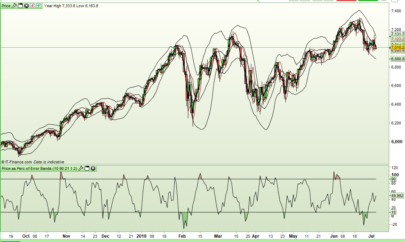
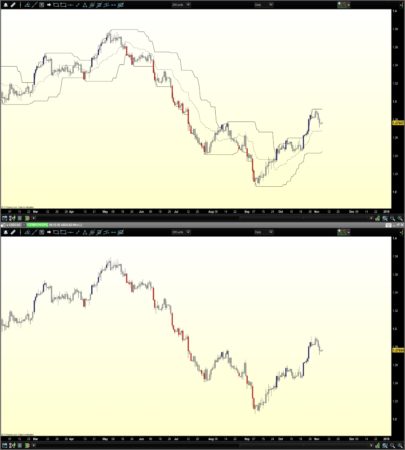
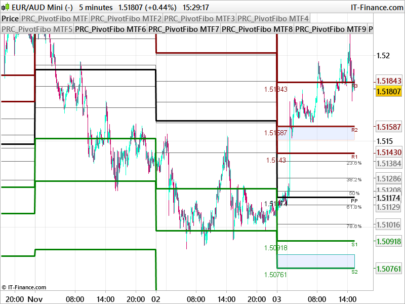
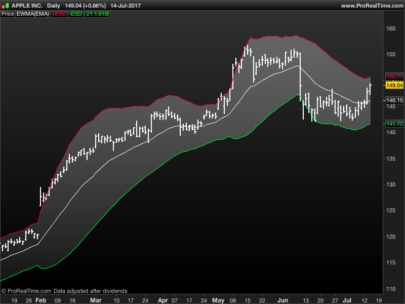
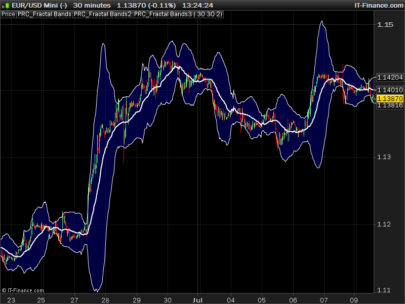
The band is smooth like a straight moving average trading band, but it also has the ability to adjust for market volatility like a Bollinger band. The width of the trading band increases gradually as the market becomes more volatile. This smooth and controlled self adjustment is key.

To create the Pivot Point Channels, I use a 7-day exponential moving average of the Pivot Points as a base. An exponential Moving Average is a little more sensitive to recent data than a straight simple moving average, however the basic principle is the same.
Next, calculate the average difference between the first Pivot Low 5 and the first Pivot High for each of the last 7 days. To do this, you subtract the first Pivot Low value from the first Pivot High value for each of the last 7 days. You then add up the difference and divide by 7. This gives you the average value of the difference between the first high and the first low pivots.
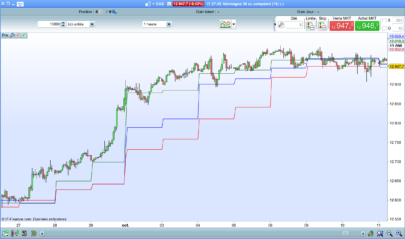
The final step involves adding this average of the differences to the moving average of the pivots to get the resistance line. As well, you subtract the average of the differences from the moving average of the pivots to get the support line. This creates a channel for the first support and resistance.
(description from the author of the indicator: Joe Duffy).
at the request of the French thread  https://www.prorealcode.com/topic/pivots-points-channel/

Adaptation of a Tradingview code.


Share this

Risk disclosure:

No information on this site is investment advice or a solicitation to buy or sell any financial instrument. Past performance is not indicative of future results. Trading may expose you to risk of loss greater than your deposits and is only suitable for experienced investors who have sufficient financial means to bear such risk.

ProRealTime ITF files and other attachments : How to import ITF files into ProRealTime platform?

PRC is also on YouTube, subscribe to our channel for exclusive content and tutorials

  1. Juanjo • 05/17/2018 #

    Hola?.
    Exactamente cuál es su utilización?.

  2. bolsatrilera • 05/17/2018 #

    Hola Juanjo, su principio esparecido a las bandas de Bollinguer.Las lineas de las bandas son los pivots que se pueden utilizar como soportes/resistencias.

avatar
Register or

Likes

avatar avatar avatar avatar avatar avatar avatar avatar
Related users ' posts
Trading_En_El_Ibex35 Para calcular el punto pivote y los niveles de soporte y resistencia para operar durante la ...
supertiti Hola mis disculpas, creia que tu eres Jose Antonio Madrigal ! gracias por las explicaci...
Trading_En_El_Ibex35 espero que las explicaciones te hayan sido de ayuda saludos
TempusFugit Masala, thanks for your contribution. I don´t like the offmarket spreads neither ;) I unders...
Uveus Tempus, me da un error al validar el codigo, sobre la variable N. Al crear el indicador me ...
TempusFugit Hi Uveus, I am guessing you inserted the code of the indicator into the system code, is ...
Paul Thanks for posting. I was currently searching how to improve day-trading based on support an...
Jessar Könntest du im Forum etwas öffnen und später darüber zu sprechen?
arahussein Hi All, I am new to trading and i find this indicator very logicail! Hence my (dumb?) quest...
redz bonjour, comment changer les paramettre de la BB en 20 , 2.2 ? hello, how to change BB sett...
Realtime82 Hi I was wondering if it would be possible to get an alert (by sound) when the signals shows...
besserwerden Hi, i like this bollinger moz arrwos. How can I use this indicator in an screener? I want to...
Nicolas No sorry, please use this file instead into a prorealtime trading platform.
rdabbs I just installed this indicator. It opens in its own pane rather than overlaid on the chart ...
Nicolas Just apply it on your price chart instead and you're ok.
finplus bonjour, il y a un problème à la fin du code avec elsif (close 0 then ... ne manque t il pas...
kj1988 Hello Nicolas, thank you for this useful indicator. Could you tell me how I can remove the...
Nicolas remove lines 101 to 103
diegofe_2000 cordial saludo NICOLAS , gracias por excelente indicador. ¿ es posible obtenerlo en MT4 ? ...
Nicolas Lo siento, pero no estoy trabajando para ayudar a la gente aquí de forma gratuita para promo...
diegofe_2000 Nicolas , gracias por tu atención. La pregunta era por curiosidad (yo no trabajo ni manejo ...
CavalierDeCesDames Bonjour Nicolas, Thanks for your use full job. I tried this indicator on a shorter timefram...
Nicolas You are welcome. I'm glad you like it.
Bolbo It does not appear over the price indicator on V11. Thanks in advance.
albertocampagna Sei grande Nicolas :-)
SAcht Dear Nicolas, Great work, thank you very much!I would love to use the indicator in ProScree...
SAcht btw: The above-posted ProScreener is supposed to show stocks for which the center line has i...
Nicolas Rien, il faut l'appliquer sur la charte. Soit le mettre sur le graphique du prix, à l'aide d...
signorini Merci pour votre réponse. Je l'applique sur la charte, j'utilise la petite clé pour effacer ...
signorini Je vous remercie, Nicolas. C'est fixé. Très bon week-end.
Abz  hi , you need to add the indicator from the "price" menu in chart
Francesco Thank you Abz!
phanz Hi Nicolas, this is an interesting strategy. For long position, I assume entry when prices ...
Wing Yes, investigate as much as you want. For more insight, you can view the linet1, linet2 etc....
CKW Hi Wing, Thanks for your sharing. I am still trying to breakdown & understand your code...
Wing Hello CKW. No, the parameter, 7 in this case, is used when calling the RSI indicator to ide...
Pere
7 years ago
juju333 Merci Nicolas, j'utilisais avec bonheur ce code dans la 10.3, il ne tourne plus dans la v11....
Nicolas Remplacer les lignes 11 et par 12 avec: yearlyHigh = Highest[max(1,BarIndex - lastYearBarI...
juju333 merci !!!
zilliq Be careful, It works only if you are in daily timeframe, and on your graphic you are on hou...
DerPat I guess you are right, like always. If you change n to 24 you have at least the hours of a d...
gabri DerPat, you can also change line1 to read as follow to adapt this script to hourly timefram...
Nicolas Use the wrench of the price chart! Upper left of the window
Dymjohn The wrench shows options for the components of the indicator not how to show in the main cha...
Nicolas http://www.prorealcode.com/topic/overlapping-indicators/  
roos Hi Nicolas, another really helpful bit of code, thank you! Can I ask how you might amend so ...
Denis Good evening Nicolas, could you tell me where thae arrows on the chart come from ? I don't s...
Nicolas there is no arrow in this indicator.
xel @DerPat - I don't see any question regarding the indicator.  Anyway, I think I give enough l...
diegofe_2000 Xel, tu eres el creador de este indicador? Bueno te  cuento que es muy bueno para hacer est...
xel Buen día @diegofe_2000 -  Claro, mandalo y por aquí lo probamos en otros instrumentos y si g...
rajiwas Hello Nicolas, With Daily Pivot, it easy for me to show current day pivot e.g. if Date = T...
Nicolas You'll find many other pivots points indicators in the library, just use the search box of t...
rajiwas Thanks for the suggestion.

Top