
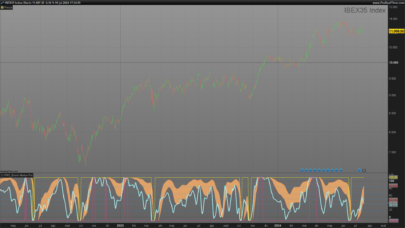
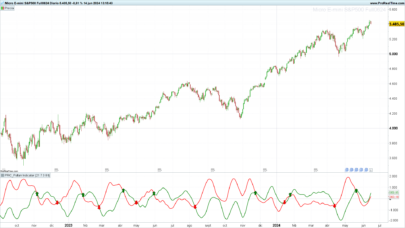
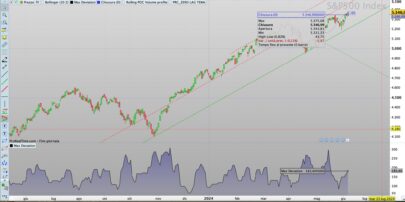
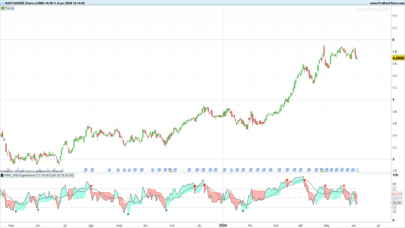
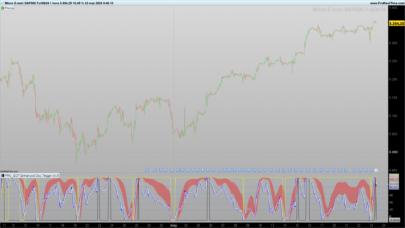
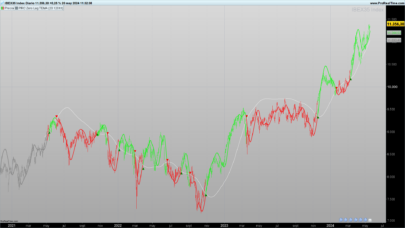
Simple representation of the percentage derivative price from a N periods moving average.
|
1 2 3 4 5 6 7 8 9 |
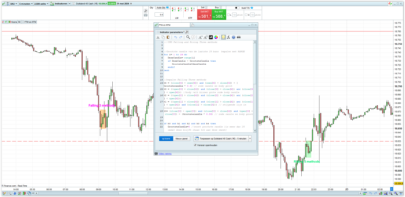
//Parameters : //Period = 200 //percentH = 15 //percentL = -15 xEMA = exponentialaverage[Period](close) nRes = (close - xEMA) * 100 / close RETURN nRes as "% deviation from MA", 0, percentH, percentL |
Share this
No information on this site is investment advice or a solicitation to buy or sell any financial instrument. Past performance is not indicative of future results. Trading may expose you to risk of loss greater than your deposits and is only suitable for experienced investors who have sufficient financial means to bear such risk.
ProRealTime ITF files and other attachments :
Find other exclusive trading pro-tools on ![]()
PRC is also on YouTube, subscribe to our channel for exclusive content and tutorials


Great job. If you divide the numerator by xEMA and not Close you obtain the Disparity Index that, used with an EMA26 represents perfectly the RSI.
ah, great, was just looking for something similar. will try this. I have also been considering adding the percents deviation from an MA as a fixed percent above/below as a line on the chart (“MA envelope”) but hasnt found any such code on the forums. maybe I’ll try to construct it myself. but thanks for this!