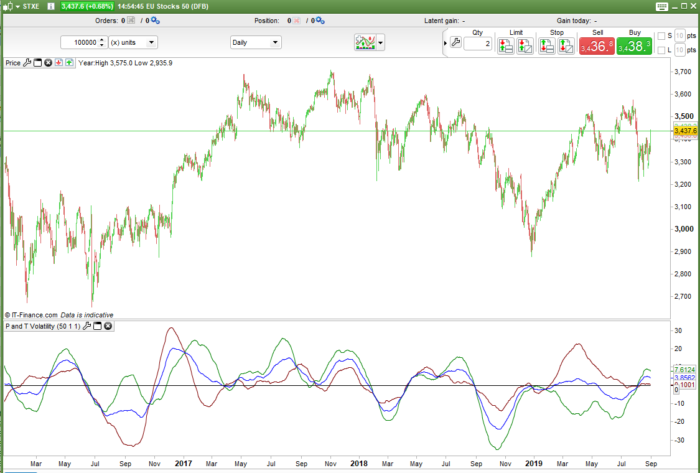
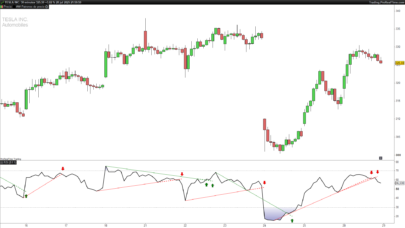
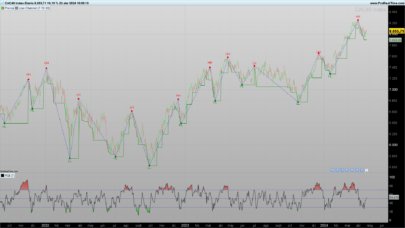
This indicator gives an indication of recent market volatility based on the number of peaks and troughs in the p look back period.
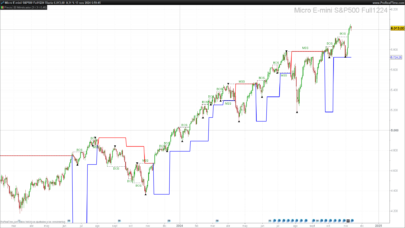
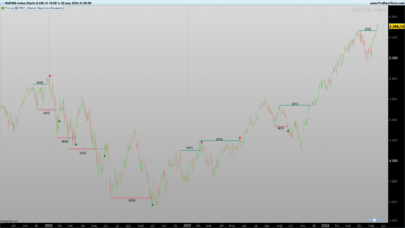
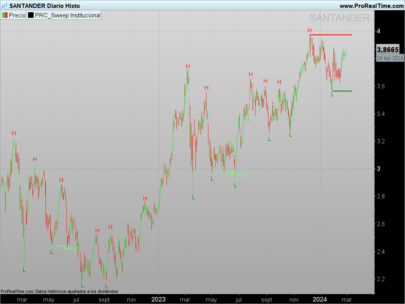
A trough or a peak can be classified by the number of bars before and after a high or low that have lower highs (for a peak) or higher lows (for a trough). Change the ‘BarsBefore’ and ‘BarsAfter’ variables to select what type of peaks and troughs you are testing for. Some people call these fractals and others pivot points and others support and resistance but I am choosing to call them peaks and troughs!
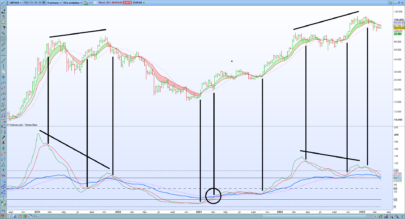
The number of peaks and troughs in the look back period are counted and returned as a weighted average line chart centred around zero. The zero line represents the all time average of peaks and troughs for the period p.
Change the look back period length by changing the value ‘p’.
The green line represents peaks (P volatility) in the look back period and the red line represents troughs (T volatility) in the look back period. The blue line is peaks and troughs (P and T volatility) combined.
Low values show that there has not been a lot of peaks or troughs recently indicating a not very volatile market.
High values show that there has been a lot of peaks or troughs recently indicating a very volatile market.
Low and High volatility readings can sometimes indicate a market that is about to change or choose a direction.
If a market has been trending then we might see the P and T volatility dropping off as the market makes less and less peaks and troughs as it heads off in whichever direction it has chosen.
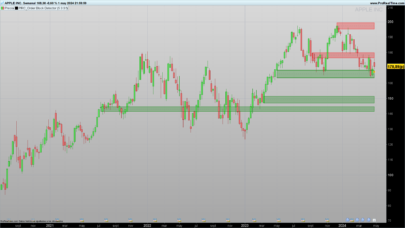
If the P value is high and the T value low then it might be that the market has recently been hitting upward resistance but little downward support.
How you finally analyse the indicators output is up to you!
I advise downloading and importing the ITF file to get full functionality.
|
1 2 3 4 5 6 7 8 9 10 11 12 13 14 15 16 17 18 19 20 21 22 23 24 25 26 27 28 29 30 31 32 33 34 |
//Peak andd Trough Volatility Indicator //By Vonasi //20090830 //p = 50 //BarsAfter = 1 //BarsBefore = 1 BarLookBack = BarsAfter + 1 if low[BarsAfter] < lowest[BarsBefore](low)[BarLookBack] then if low[BarsAfter] = lowest[BarLookBack](low) then sup=sup + 1 endif endif if high[BarsAfter] > highest[BarsBefore](high)[BarLookBack] then if high[BarsAfter] = highest[BarLookBack](high) then res=res + 1 endif endif rsup = (sup - sup[p-1])*2 rres = (res - res[p-1])*2 tot = (rsup + rres)/2 ata = ((res + sup)/barindex)*p tt = weightedaverage[p](rsup) pp = weightedaverage[p](rres) pt = weightedaverage[p](tot) ttperc = ((tt/ata)*100)-100 ppperc = ((pp/ata)*100)-100 ptperc = ((pt/ata)*100)-100 return ttperc coloured(128,0,0) as "T Volatity", ppperc coloured(0,128,0) as "P Volatility", ptperc coloured(0,0,255) as "P and T Volatility",0 |
Share this
No information on this site is investment advice or a solicitation to buy or sell any financial instrument. Past performance is not indicative of future results. Trading may expose you to risk of loss greater than your deposits and is only suitable for experienced investors who have sufficient financial means to bear such risk.
ProRealTime ITF files and other attachments :
Find other exclusive trading pro-tools on ![]()
PRC is also on YouTube, subscribe to our channel for exclusive content and tutorials


Well done Vonasi !
You have a lot of ideas.
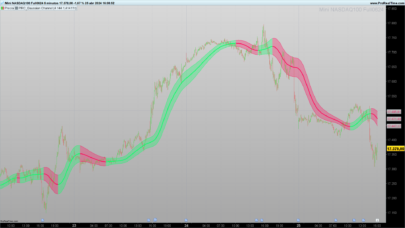
Personally, I work with Moving Averages only. Whether in a bounded indicator or not.
Very interesting approach Vonasi! I’m getting a 404 error when trying to download though?
I just tested and I was able to download with no error.
Hi Vonasi,
I am a newbie and was wondering whether you could possibly help me with this problem:
I would like to make an indicator with 3 Williams %R with 3 different periods and on each a Weighted Moving Average. I don’t manage to do this and would greatly appreiate your help.