







Range Filtered Trend Signals indicator
1. Introduction
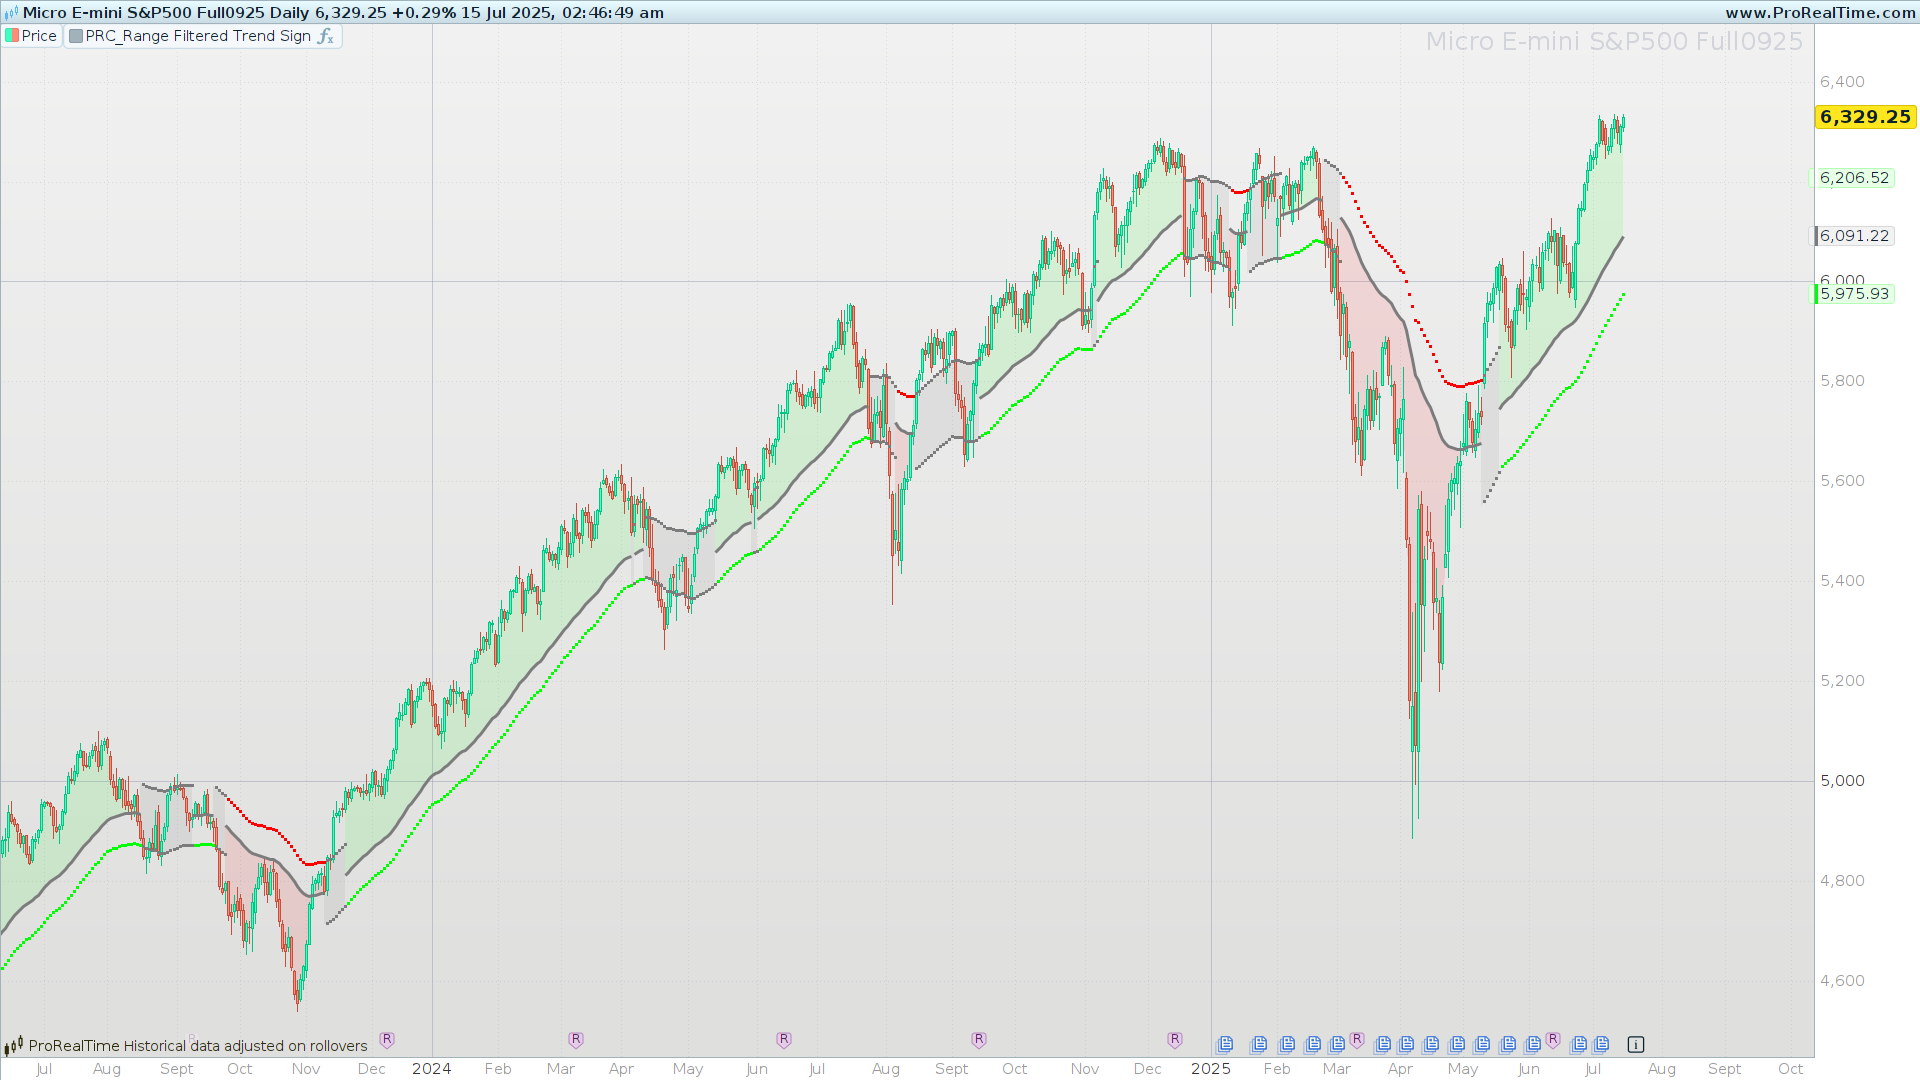
The Range Filtered Trend Signals indicator (by AlgoAlpha) is a composite tool designed to help traders identify both tentative “in-range” price movements and decisive trend changes. By combining three powerful elements
- a Kalman filter to smooth price noise,
- a SuperTrend algorithm to gauge directional bias on the filtered line, and
- a volatility-based range filter to spot mild breakouts—
this indicator offers clear visual cues for entries and exits on any market or timeframe.
Why combine these components?
- Noise reduction: The Kalman filter adaptively smooths price data, preserving real movements while suppressing random fluctuations.
- Trend bias: SuperTrend applied to the smoothed line defines when the market is trending up or down.
- Range filtering: Dynamic bands based on recent volatility highlight genuine momentum moves without overreacting to micro-noise.
Together, they produce two distinct signal types:
- “In-range” breakouts (dots when price crosses a volatility band but trend has not yet shifted), and
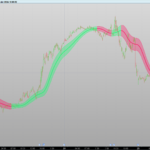
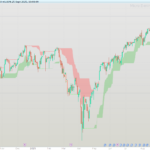
- Trend-change alerts (colored fills when the filtered line flips relative to the SuperTrend).
2. Input Parameters
| Parameter | Default | Description | Recommended Range |
|---|---|---|---|
| kalmanAlpha | 0.01 | Measurement noise coefficient; smaller values yield smoother filtering but slower response. | 0.005 – 0.05 |
| kalmanBeta | 0.10 | Process noise coefficient; controls adaptability of the error covariance update. | 0.05 – 0.2 |
| kalmanPeriod | 77 | Period factor in the Kalman update; higher values emphasize longer-term smoothing. | 50 – 150 |
| dev | 1.20 | Multiplier for the range bands; determines band width relative to recent volatility. | 1.0 – 2.0 |
| supertrendFactor | 0.70 | ATR multiplier for SuperTrend; larger values produce wider SuperTrend bands (less frequent flips). | 0.5 – 3.0 |
| supertrendAtrPeriod | 7 | ATR look-back for SuperTrend; controls sensitivity to true range fluctuations. | 5 – 14 |
Tip: Start with the default values, then tweak one group at a time (Kalman vs. SuperTrend vs. range factor) to match your preferred balance of responsiveness vs. noise suppression.
3. Internal Logic
3.1 Kalman Filter Smoothing
The Kalman filter produces a smoothed price line K by iteratively updating:
- Estimate update:
–v3 = kalmanAlpha * kalmanPeriod
–gain = v2 / (v2 + v3)
–v1 = v1_prev + gain * (close – v1_prev) - Error covariance update:
–v2 = (1 – gain) * v2 + kalmanBeta / kalmanPeriod
Here, v1 is the estimated true price, and v2 is its error variance. Smaller kalmanAlpha/larger kalmanPeriod yield heavier smoothing; a higher kalmanBeta adapts variance faster when volatility changes.
3.2 SuperTrend on the Filtered Line
Using the smoothed series K as the “price,” a standard SuperTrend computation defines two bands:
- UpperBand = K + supertrendFactor × ATR(supertrendAtrPeriod)
- LowerBand = K – supertrendFactor × ATR(supertrendAtrPeriod)
Logic ensures each band only moves in a favorable direction (Upper never decreases unless broken, Lower never increases unless broken). The SuperTrend line itself alternates between the latest Upper and Lower band depending on whether K is above or below the prior band—yielding a clean up/down bias on the Kalman-filtered price.
3.3 Volatility-Based Range Filter
A Weighted Average of the daily range (high – low) over 200 bars defines vola—a smoothed measure of recent volatility. Two dynamic range bands are then set:
- UpperRange = K + dev × vola
- LowerRange = K – dev × vola
These bands capture typical short-term swings around the Kalman line.
3.4 Signal Generation
The indicator produces two types of visual signals:
- In-Range Breakouts:
- When the current close crosses above UpperRange or below LowerRange, and the SuperTrend line has not just flipped (
isupertrend = isupertrend[1]), a small dot is plotted at the breakout point. This flags a potential pullback or continuation within the prevailing trend.
- When the current close crosses above UpperRange or below LowerRange, and the SuperTrend line has not just flipped (
- Trend-Change Alerts:
- When the SuperTrend line flips (i.e., its value differs from the prior bar) and K has crossed through the old band, the chart background (or the Kalman line) is filled in green for an up-flip or red for a down-flip. This highlights a more decisive shift in market direction.
4. Interpretation of Signals
- In-Range Breakouts (Dots):
- Purpose: Catch smaller, intra-trend opportunities without waiting for a full trend flip.
- How to trade: Look for price retests of the breakout level or close-of-bar confirmation before entering in the direction of the predominant trend.
- Trend-Change Alerts (Fills):
- Purpose: Identify robust reversals when noise has been removed and volatility bands confirm momentum beyond typical ranges.
- How to trade: Consider these as primary entry/exit points—enter on the next bar after the fill appears, or wait for a retest of the SuperTrend line for a more conservative approach.
Example Scenario: On an hourly chart of EUR/USD, price may cross the upper range band (dot signal) three times, indicating small pullbacks within an uptrend. Eventually, the Kalman-filtered line pierces the SuperTrend band and the background turns green—a high-conviction signal to establish a new long position.
5. Configuration and Advanced Adjustments
- Adapting to Timeframes:
- Shorter timeframes (e.g., 5 min) often require a smaller
kalmanPeriod(e.g., 50) and slightly higherdev(e.g., 1.5) to avoid false dots. - Longer charts (daily/weekly) benefit from a larger
kalmanPeriod(100–150) and modestsupertrendFactor(1.5–2.0) for stable swings.
- Shorter timeframes (e.g., 5 min) often require a smaller
- Optimizing Kalman vs. SuperTrend:
- Increase
kalmanBetaif the filter is too sluggish to adapt after sudden volatility spikes. - Raise
supertrendAtrPeriodif you want the trend filter to ignore small whipsaws.
- Increase
- Volatility Regime Tuning:
- In trending, low-volatility markets, reduce
devtoward 1.0 to tighten bands and capture earlier in-range moves. - In choppy/high-volatility periods, raise
devtoward 2.0 to avoid over-signaling.
- In trending, low-volatility markets, reduce
- Combining with Other Tools:
- Use higher-timeframe Simple Moving Averages or RSI to confirm the direction flagged by this indicator.
- Overlay support/resistance zones to validate Swing entries on dot signals.
6. Full ProBuilder Code
//-----------------------------------------------------//
//PRC_Range Filtered Trend Signals | indicator
//16.06.2025
//Iván González @ www.prorealcode.com
//Sharing ProRealTime knowledge
//translated from tradingview code
//-----------------------------------------------------//
// --- Parámetros de Entrada ---
//-----------------------------------------------------//
// Grupo Filtro Kalman
kalmanAlpha = 0.01
kalmanBeta = 0.1
kalmanPeriod = 77
dev = 1.2
// Grupo Supertrend
supertrendFactor = 0.7
supertrendAtrPeriod = 7
//-----------------------------------------------------//
// --- Lógica del Filtro Kalman ---
//-----------------------------------------------------//
ONCE v2 = 1.0
IF BarIndex <= 1 THEN
   v1 = close[1]
else
   v3 = kalmanAlpha * kalmanPeriod
   v5 = v1
   v4 = v2 / (v2 + v3)
   v1 = v5 + v4 * (close - v5)
   v2 = (1 - v4) * v2 + kalmanBeta / kalmanPeriod
ENDIF
k = v1 // Línea del Filtro Kalman
//-----------------------------------------------------//
// --- Lógica del Supertrend ---
//-----------------------------------------------------//
src=k
atr=averagetruerange[supertrendAtrPeriod]

upperband=src+supertrendFactor*atr
lowerband=src-supertrendFactor*atr

if barindex<=supertrendAtrPeriod then

   upperband=src
   lowerband=src
   direction=1
   isupertrend=src

else

   if lowerband>lowerband[1] or k[1]<lowerband[1] then
      lowerband=lowerband
   else
      lowerband=lowerband[1]
   endif

   if upperband<upperband[1] or k[1]>upperband[1] then
      upperband=upperband
   else
      upperband=upperband[1]
   endif

   if isupertrend[1]=upperband[1] then
      if k>upperband then
         direction=-1
      else
         direction=1
      endif
   else
      if k<lowerband then
         direction=1
      else
         direction=-1
      endif
   endif

   if direction=-1 then
      isupertrend=lowerband
   else
      isupertrend=upperband
   endif

endif
//-----------------------------------------------------//
// --- Lógica Principal del Indicador ---
//-----------------------------------------------------//
vola = WeightedAverage[200](high - low)

// Bandas del Filtro de Rango
upper = k + vola * dev
lower = k - vola * dev

midbody = (close + open) / 2
//-----------------------------------------------------//
// --- Visualización y Dibujo ---
//-----------------------------------------------------//
rk=124
gk=124
bk=124
ak=255

if close crosses over upper and isupertrend=isupertrend[1] then
   r=124
   g=124
   b=124
   a1=255
   a2=255
   inrange=1
elsif close crosses under lower and isupertrend=isupertrend[1] then
   r=124
   g=124
   b=124
   a1=255
   a2=255
   inrange=1
elsif isupertrend<>isupertrend[1] and k<isupertrend then
   r=255
   g=0
   b=0
   a1=255
   a2=0
   inrange=0
elsif isupertrend<>isupertrend[1] and k>isupertrend then
   r=0
   g=255
   b=0
   a1=0
   a2=255
   inrange=0
endif
if inrange=1 then
   ak=0
endif
//-----------------------------------------------------//
colorbetween(k,midbody,r,g,b,ak*0.1)
colorbetween(lower,upper,124,124,124,30*inrange)
//-----------------------------------------------------//
return k as "K" style(line,3)coloured(rk,gk,bk,ak), upper as "Upper" coloured(r,g,b,a1)style(point,2), lower as "Lower" coloured(r,g,b,a2)style(point,2)
Comments
You must be logged in to post a comment.


Hi Ivan, unfortunatelly I still hace some problem using timeframe 3 minutes in 1 minutes, the indicator it seems is not working fine. Using the original in 3 minutes the result is different. I opened a post in https://www.prorealcode.com/topic/use-of-indicator-with-timeframe-3-minutes-in-wiindow-with-1-minute/ in order to be able to attach the screenshot of the display. Please could you take a look? Thank you in advance!! Ciao Franco
Thank you so much!!!!!! :):)
Hi Ivan, thanks a lot, very useful. I trieed to put a timeframe of 3 minutes on the first line and a timeframe default before the colorbwtween instractions, in order to use it in the windows of 1 minutes Unfortunatelly it doesn't work , please could you check what it is wrong? //-----------------------------------------------------// //PRC_Range Filtered Trend Signals | indicator //16.06.2025 //Iván González @ www.prorealcode.com //Sharing ProRealTime knowledge //translated from tradingview code //-----------------------------------------------------// // --- Parámetros de Entrada --- //-----------------------------------------------------// // Grupo Filtro Kalman TIMEFRAME(3 minutes, UPDATEONCLOSE ) kalmanAlpha = 0.01 kalmanBeta = 0.1 kalmanPeriod = 77 dev = 1.2 // Grupo Supertrend supertrendFactor = 0.7 supertrendAtrPeriod = 7 //-----------------------------------------------------// // --- Lógica del Filtro Kalman --- //-----------------------------------------------------// ONCE v2 = 1.0 IF BarIndex <= 1 THEN v1 = close[1] else v3 = kalmanAlpha * kalmanPeriod v5 = v1 v4 = v2 / (v2 + v3) v1 = v5 + v4 * (close - v5) v2 = (1 - v4) * v2 + kalmanBeta / kalmanPeriod ENDIF k = v1 // Línea del Filtro Kalman //-----------------------------------------------------// // --- Lógica del Supertrend --- //-----------------------------------------------------// src=k atr=averagetruerange[supertrendAtrPeriod] upperband=src+supertrendFactor*atr lowerband=src-supertrendFactor*atr if barindexlowerband[1] or k[1]<lowerband[1] then lowerband=lowerband else lowerband=lowerband[1] endif if upperbandupperband[1] then upperband=upperband else upperband=upperband[1] endif if isupertrend[1]=upperband[1] then if k>upperband then direction=-1 else direction=1 endif else if k<lowerband then direction=1 else direction=-1 endif endif if direction=-1 then isupertrend=lowerband else isupertrend=upperband endif endif //-----------------------------------------------------// // --- Lógica Principal del Indicador --- //-----------------------------------------------------// vola = WeightedAverage[200](high - low) // Bandas del Filtro de Rango upper = k + vola * dev lower = k - vola * dev midbody = (close + open) / 2 //-----------------------------------------------------// // --- Visualización y Dibujo --- //-----------------------------------------------------// rk=124 gk=124 bk=124 ak=255 if close crosses over upper and isupertrend=isupertrend[1] then r=124 g=124 b=124 a1=255 a2=255 inrange=1 elsif close crosses under lower and isupertrend=isupertrend[1] then r=124 g=124 b=124 a1=255 a2=255 inrange=1 elsif isupertrendisupertrend[1] and k<isupertrend then r=255 g=0 b=0 a1=255 a2=0 inrange=0 elsif isupertrendisupertrend[1] and k>isupertrend then r=0 g=255 b=0 a1=0 a2=255 inrange=0 endif if inrange=1 then ak=0 endif TIMEFRAME(default, UPDATEONCLOSE ) //-----------------------------------------------------// colorbetween(k,midbody,r,g,b,ak*0.1) colorbetween(lower,upper,124,124,124,30*inrange) //-----------------------------------------------------// return k as "K" style(line,3)coloured(rk,gk,bk,ak), upper as "Upper" coloured(r,g,b,a1)style(point,2), lower as "Lower" coloured(r,g,b,a2)style(point,2)

format de fichier incorrect ???
Grazie IVAN per questo lindicatore che mi sembra molto interessante, putroppo, non essendo un esperto, ho difficoltà ad individuare i punti in cui la tendenza diventa rialzista/ribassista. Ho provato con "isupertrendisupertrend[1] and k>isupertrend" ma non va bene; qualcuno può aiutarmi. Grazie