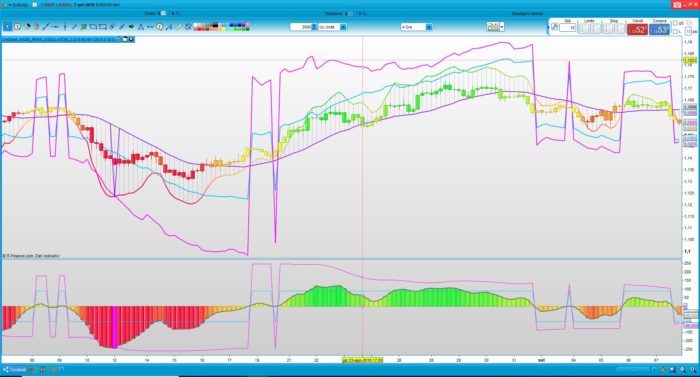
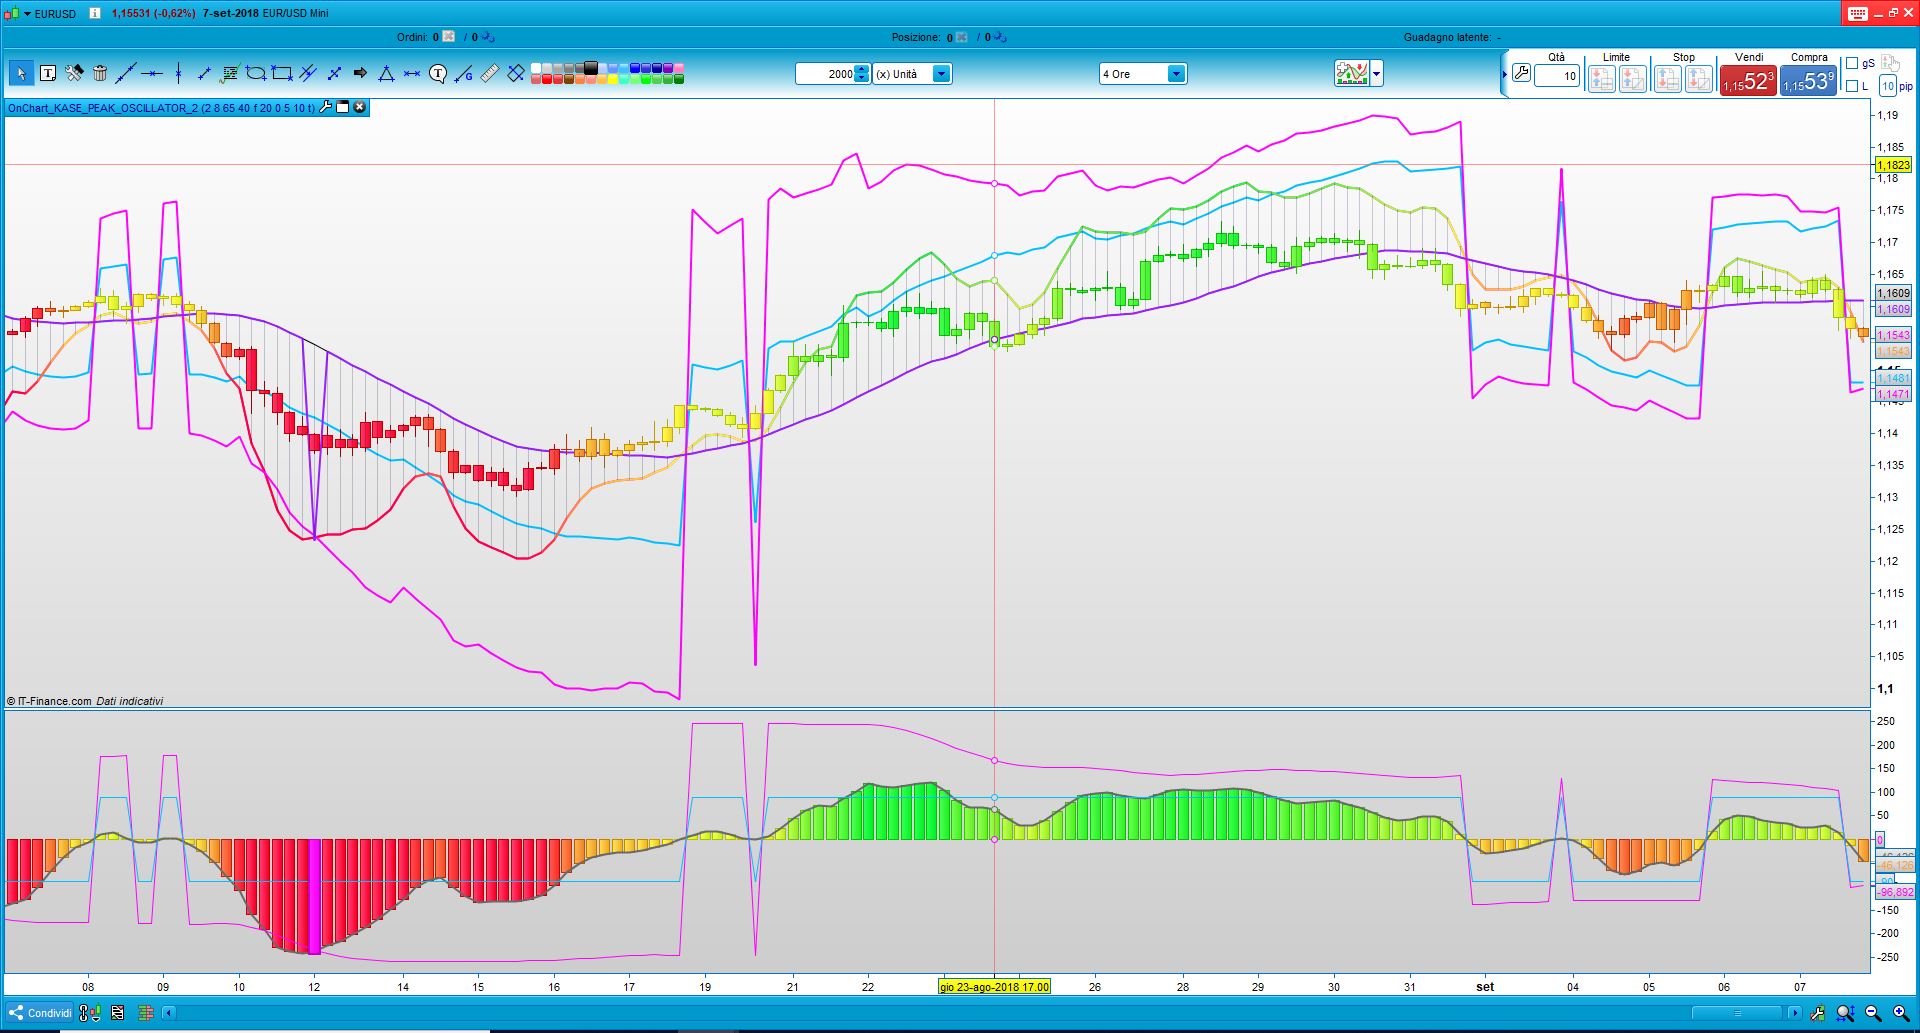
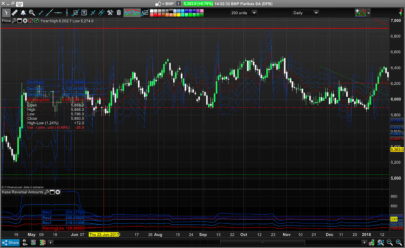
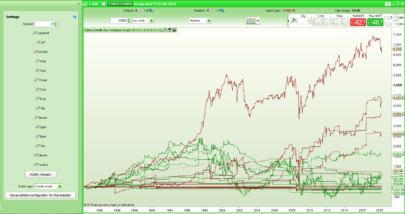
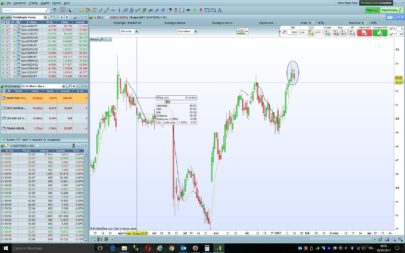
The “onChart Kase_Peak_2_Coloured” indicator plots Kase Peak 2 Oscillator directly overlaid on the price chart, and candlestiks colours allows to interpret the values of KPH that could be plot or not like histogram (grey segment) on chart.
The Moving average of 20 periods is the center of the oscillator like zero level.
To maintain a correct range dimensions of the oscillator, I’ve suggest the following setting:
Time Frame 1 D – Setting ATRperiod=20
Time Frame 4 H – Setting ATRperiod=10
Time Frame 1 H – Setting ATRperiod=4
Time Frame 30 m – Setting ATRperiod=2
Time Frame 15 m – Setting ATRperiod=2
Time Frame 5 m – Setting ATRperiod=2
Time Frame 1 m – Setting ATRperiod=1
|
1 2 3 4 5 6 7 8 9 10 11 12 13 14 15 16 17 18 19 20 21 22 23 24 25 26 27 28 29 30 31 32 33 34 35 36 37 38 39 40 41 42 43 44 45 46 47 48 49 50 51 52 53 54 55 56 57 58 59 60 61 62 63 64 65 66 67 68 69 70 71 72 73 74 75 76 77 78 79 80 81 82 83 84 85 86 87 88 89 90 91 92 93 94 95 96 97 98 99 100 101 102 103 104 105 106 107 108 109 |
//PRC_OnChart Kase Peak 2 Coloured | indicator //08.09.2018 //Ale @ www.prorealcode.com //Sharing ProRealTime knowledge //WWW.AUTOMATICTRADING.IT DEFPARAM CALCULATEONLASTBARS=1000 ///////////////////////INDICATOR_KASE PEAK2 maPrice = customclose // --- settings kpoDeviations = 2.0 // Kase peak oscillator deviations kpoShortCycle = 8 // Kase peak oscillator short cycle kpoLongCycle = 65 // Kase peak oscillator long cycle kpoSensitivity = 40 allPeaksMode = 1 //1=true ; 0=false AveragePeriod=20 AverageMethod=1 TightenChannel=5 ATRperiod=20 // --- end of settings if barindex>kpoLongCycle*2 then ccLog = Log(Close[0]/Close[1]) ccDev = std[9](ccLog) avg = average[30](ccDev) if (avg>0) then max1 = 0 maxs = 0 for k = kpoShortCycle to kpoLongCycle-1 do max1 = Max(Log(High[0]/Low[0+k])/Sqrt(k),max1) maxs = Max(Log(High[0+k]/Low[0])/Sqrt(k),maxs) next x1 = max1/avg xs = maxs/avg endif xp = kpoSensitivity*(average[3](x1)-average[3](xs)) xpAbs = Abs(xp) kpoBuffer = xp kphBuffer = xp tmpVal = average[50](xpAbs)+kpoDeviations*std[50](xpAbs) maxVal = Max(90.0,tmpVal) minVal = Min(90.0,tmpVal) if (kpoBuffer > 0) then kpdBuffer = maxVal kpmBuffer = minVal else kpdBuffer = -maxVal kpmBuffer = -minVal endif kppbuffer=0 if (not allPeaksMode) then if (kpoBuffer[1]>0 and kpoBuffer[1]>kpoBuffer[0] and kpoBuffer[1]>=kpoBuffer[2] and kpoBuffer[1]>= maxVal) then kppBuffer = kpoBuffer[1] endif if (kpoBuffer[1]<0 and kpoBuffer[1]<kpoBuffer[0] and kpoBuffer[1]<=kpoBuffer[2] and kpoBuffer[1]<=-maxVal) then kppBuffer = kpoBuffer[1] endif else if (kpoBuffer[1]>0 and kpoBuffer[1]>kpoBuffer[0] and kpoBuffer[1]>=kpoBuffer[2]) then kppBuffer = kpoBuffer[1] endif if (kpoBuffer[1]<0 and kpoBuffer[1]<kpoBuffer[0] and kpoBuffer[1]<=kpoBuffer[2]) then kppBuffer = kpoBuffer[1] endif endif endif /////////////////////////////////////////////////// dTR = 0 for i = 0to ATRperiod-1 dTR=dTR+max(abs(Dhigh(i)-Dlow(i)),max(abs(Dhigh(i)-Dclose(i+1)),abs(Dlow(i)-Dclose(i+1)))) next dtr=dtr/MAX(1,TightenChannel) avgRange = dTR maValue = average[max(1,AveragePeriod),AverageMethod](maPrice) KPMValue=kpMBuffer KPOValue=kpoBuffer KPHValue=kphBuffer KPDValue=kpdBuffer KPPValue=kppBuffer Buffer1=maValue Buffer4=maValue+(KPMValue)/100*avgRange buffer5=maValue+(KPOValue)/100*avgRange buffer6=maValue+(KPHValue)/100*avgRange buffer7=maValue+(KPDValue)/100*avgRange buffer8=maValue+(KPPValue)/100*avgRange r = 50+(100-(KPHBUFFER))*2 g = 50+(100+(KPHBUFFER))*2 DRAWCANDLE(open, high, low, close)coloured(R,G,50) IF not ViewHistogram then buffer6=mavalue buffer5=mavalue endif DRAWCANDLE(open, high, low, close)coloured(R,G,50) DRAWSEGMENT(barindex, maValue, barindex,buffer6)coloured(0,0,50,50) return Buffer1 coloured(0,0,0) style(line,1) as "0 level", Buffer4 coloured(0,191,255) style(LINE,2) as "KPM",Buffer5 coloured(255,0,255) style(LINE,2) as "KPO",Buffer6 coloured(R,G,50) style(LINE,2) as "KPH",Buffer7 coloured(255,0,255) style(LINE,2) as "KPD",Buffer8 coloured(155,30,255) style(LINE,2) as "KPP" |
Share this
No information on this site is investment advice or a solicitation to buy or sell any financial instrument. Past performance is not indicative of future results. Trading may expose you to risk of loss greater than your deposits and is only suitable for experienced investors who have sufficient financial means to bear such risk.
ProRealTime ITF files and other attachments :
Find other exclusive trading pro-tools on ![]()
PRC is also on YouTube, subscribe to our channel for exclusive content and tutorials
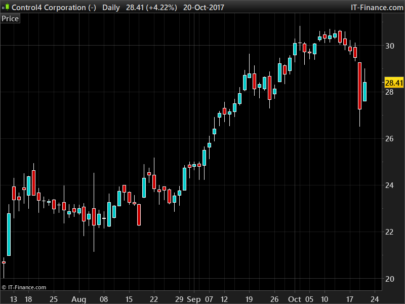


Very interresting indeed. But which preferences to select in the indicator in order to display it like you show on the picture. Per default, I just manage to get the “3D candles”… Tx in advance.
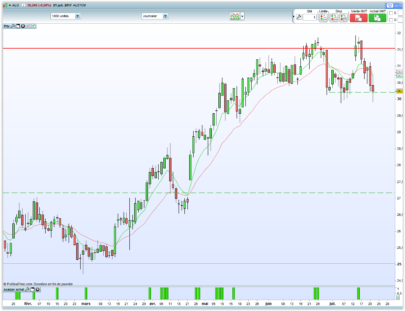
Hi @Ale, I was wondering if you knew why, when I went to put the Kase Peak Oscillator into it’s own indicator window, it is floating / curved and not horizontal / flat as in the lower half of the picture you supplied for this post? Cheers, Bard
Chart here: https://www.dropbox.com/s/zclc2zoee361ca3/KPOcurved.png?dl=0
Settings here: https://www.dropbox.com/s/ndqbuu9b5x0xw4o/KPOsettings.png?dl=0
Hello Bard,
because they are two different indicators
Right, thanks Ale,
I have taken your code and made a coloured Peak Osc (thanks again) but it “floats” and would prefer it to be flat on the x-axis! Not sure what the code is that does that? Did you ever post this Kase Peak Osc as a coloured stand alone chart indicator? It would be great to see it because it makes the divergences definitely easier to spot.