Hi all,
Here is an indicator that could be particularly useful for day traders. I found this idea on a website, obviously not well-known because I can not find it anymore.
This indicator works like pivot points, but it is more simple.
As a reminder, the pivot point is calculated as follows : average between the high of the day before, the low of the day before and the close of yesterday.
I have some problems with the calculation of the pivot point : the closing clearly depends on the closing time of your broker, and also the time zone.
Indeed, according to your broker:
– if you trade for example a CFD on France 40, you will have candles from 00H to 00H with some brokers like IG, or from 08H to 22H with some other brokers, etc.
– if you trade forex, candles can go from 23H to 23H, or from 00H to 00H : they will not be quite the same, so the calculation of the pivot points will not be the same.
Here, this indicator will clearly get rid of this problem, since it will only consider the highest and the lowest of the previous days.
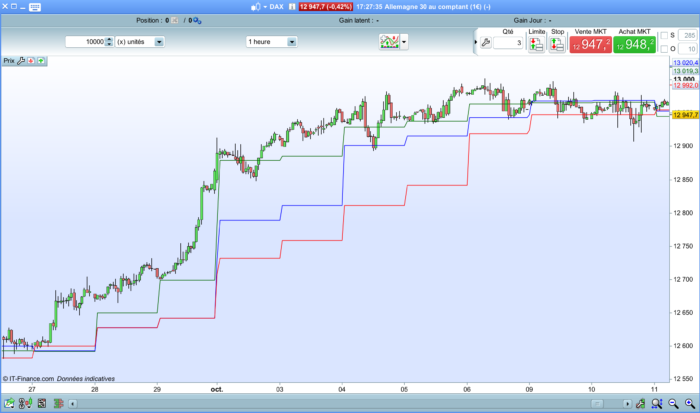
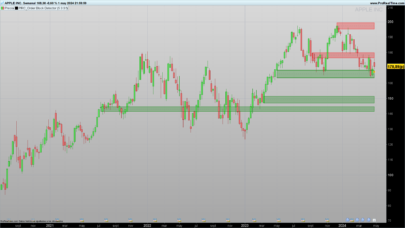
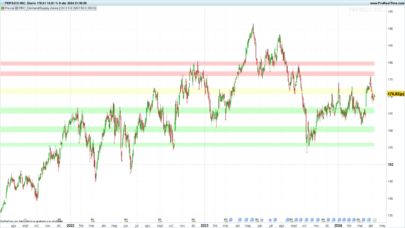
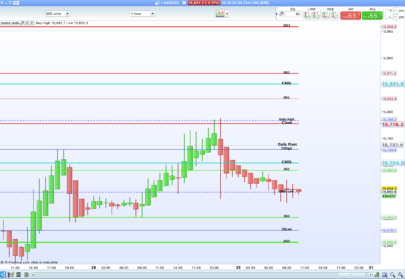
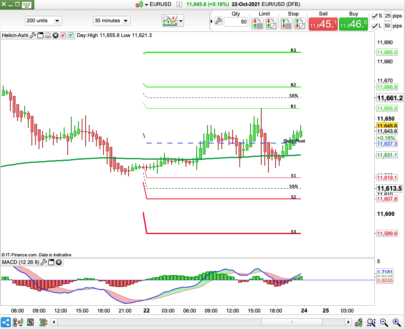
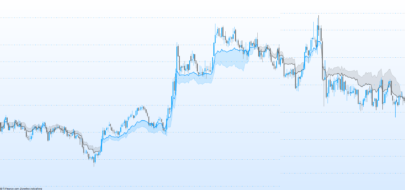
Here’s what this indicator shows:
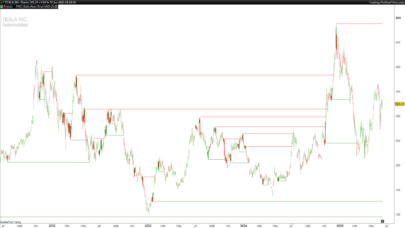
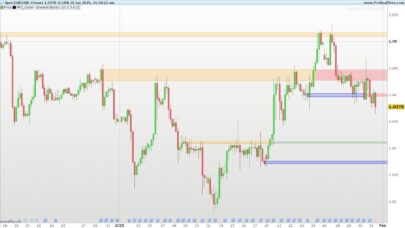
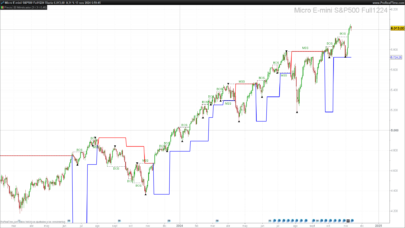
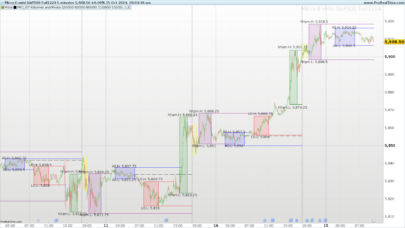
– a GREEN line for the average of the highest and lowest of the previous day
– a BLUE line for the average of the highest and the lowest of the last 3 days
– a RED line for the average of the highest and the lowest of the last 5 days
What is the purpose of this indicator ?
– It allows to have a visualization of the current momentum : as for the pivot points, the position of the prices with respect this set of levels (which can almost be considered as a kind of pivot points) makes it possible to visualize the trend
– It allows to consider entries for « long » trades (break of the highest line), or for « short » trades (break of the lowest line)
You are free to set the rules of your strategy, such as :
– stop loss (eg at the opposite line / precise number of points)
– take profit (number of points / last higher or lower / stop follower)
etc.
Personally, I didn’t yet dig the question more than that ; but…
– I think this simple approach must be effective, also limiting the risk of overtrading, and could serve as a basis for an effective day trading strategy.
– I propose you to try to use this strategy, to test different rules, and to communicate to me the results
So, together we could develop an effective day trading strategy, shared by all.
Best regards and Happy trading
Here is the code :
|
1 2 3 4 5 6 7 8 9 10 11 12 13 14 15 16 17 18 19 20 21 22 23 24 25 26 27 28 29 30 31 32 33 34 35 36 37 38 39 40 41 42 |
// MID-LEVEL 1 DAY : mid1day mid1day = (DHigh(1) + DLow(1) ) / 2 // MID-LEVEL 3 DAYS : mid3day Newhigh = 0 For i = 1 to 3 do IF Dhigh(i) > Newhigh THEN Newhigh = Dhigh(i) ENDIF NEXT Newlow = 1000000000000 // = valeur infinie For i = 1 to 3 do IF Dlow(i) < Newlow THEN Newlow= Dlow(i) ENDIF NEXT mid3day = (Newhigh + Newlow) /2 // MID-LEVEL 5 DAYS : mid5day Newhigh = 0 For i = 1 to 5 do IF Dhigh(i) > Newhigh THEN Newhigh = Dhigh(i) ENDIF NEXT Newlow = 1000000000000 For i = 1 to 5 do IF Dlow(i) < Newlow THEN Newlow= Dlow(i) ENDIF NEXT mid5day = (Newhigh + Newlow) /2 RETURN mid1day coloured(0,100,0), mid3day coloured(0,0,255), mid5day coloured(255,0,0) |
Share this
No information on this site is investment advice or a solicitation to buy or sell any financial instrument. Past performance is not indicative of future results. Trading may expose you to risk of loss greater than your deposits and is only suitable for experienced investors who have sufficient financial means to bear such risk.
ProRealTime ITF files and other attachments :
Find other exclusive trading pro-tools on ![]()
PRC is also on YouTube, subscribe to our channel for exclusive content and tutorials


Hallo, wirklich ein sehr guter Indikator!
Ich bin Programmier technisch leider noch ein Anfänger, könnten sie mir helfen diesen Indikator in einen Code einzubauen.
Würde in gerne als Trend Filter verwenden, hätte mir sowas gedacht wie IF mid1day > mid5day then c1 = 1 aber wenn ich mid1day verwende findet er es nicht! danke
Wäre auch super wenn wir dieses Gespräch in das Forum verlegen könnten.
Really good, thanks a lot 🙂
Thanks for posting. I was currently searching how to improve day-trading based on support and resistance levels. Definitely will focus next strategy based on this indicator and will post back!
Könntest du im Forum etwas öffnen und später darüber zu sprechen?
Hi All,
I am new to trading and i find this indicator very logicail! Hence my (dumb?) question, has anyone had tried this for swingtrading? If yes, any guidence on how to proceed?
Many thanks in advance,
Aram