







EOD Cash Market Pivots – Index Trading
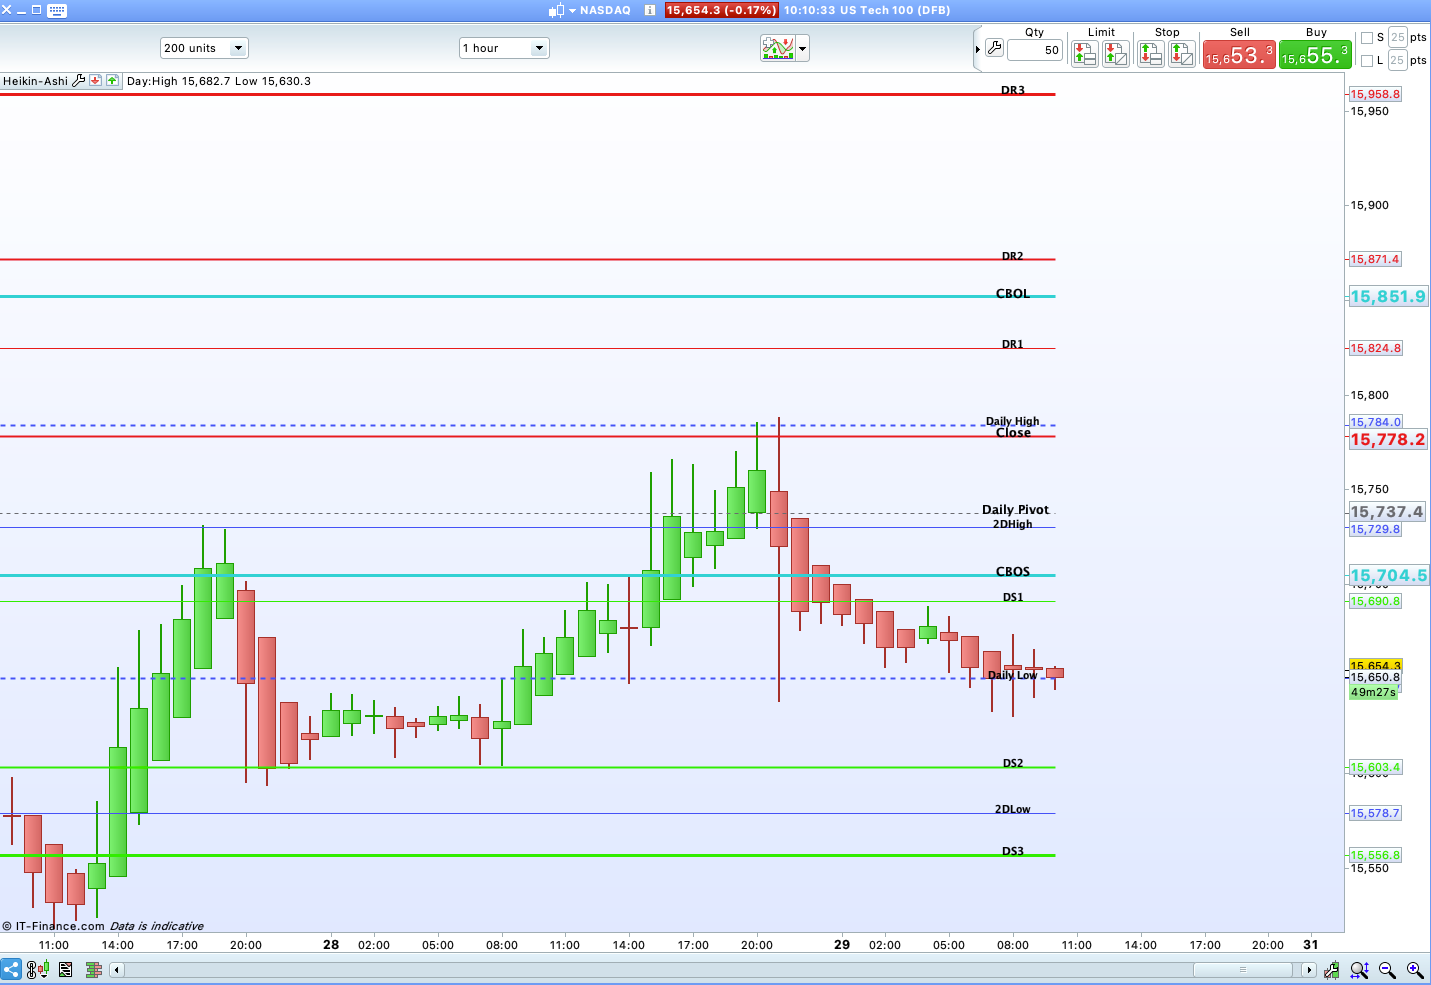
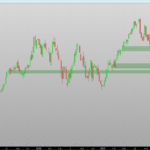
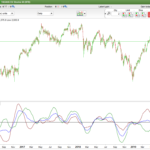
The pivot point(s) are interpreted as a progressive direct support and resistance level, which determines the primary trend. In addition, first to third level resistance and support points serve as additional indicators of possible trend reversal or continuation (Based on Floor Pivot Points).
CBOL/CBOS (Camarilla BreakOut Long/Short) are R4 based Camarilla pivot points and help identify breakout and support trading, especially around a cash market open.
//End Of Day (EOD) cash pivots for use in cash markets - Indicies
//0ct 2021
//www.harkoltd.com
//============================================

defparam drawonlastbaronly = true
// settings
MHi = 0
MLo = 0
PDH = 0
PDL = 0
TodayOnly = 1
// ---------------------


MP = UNDEFINED
CBOL = UNDEFINED
CBOS = UNDEFINED
CSHT = UNDEFINED
CLNG = UNDEFINED
MR3 = UNDEFINED
MR2 = UNDEFINED
MR1 = UNDEFINED
MS1 = UNDEFINED
MS2 = UNDEFINED
MS3 = UNDEFINED
MMLO = UNDEFINED
MMHI = UNDEFINED
MGAP = UNDEFINED
MPDH = UNDEFINED
MPDL = UNDEFINED

SHOW = (TodayOnly and DATE[0] > Yesterday)

IF SHOW or NOT TodayOnly THEN
MP = ( (MClose + MHi + MLo )  / 3)
CBOL = MClose +  ( ( (MHi  - MLo) * 1.1) / 2)
CBOS = MClose - ( ( (MHi  - MLo ) * 1.1) / 2)
MR3 = MHi + ( 2 * (MP - MLo) )
MR2 = MP + (MHi - MLo)
MR1 = (2 * MP) - MLo
MS1 = (2 * MP) - MHi
MS2 = MP - (MHi - MLo)
MS3 = MLo - ( 2 * (MHi - MP) )
MMLO = MLO
MMHI = MHI
MPDH = PDH
MPDL = PDL
MGAP = MCLOSE

//vertical offset to draw text correctly over horizontal lines, can change to yor own liking
Voffset = 2*pipsize

//draw pivot points text
DRAWTEXT(" Daily Pivot",barindex-2,MP+Voffset,SansSerif,Bold,12)
DRAWTEXT("CBOL",barindex-2,CBOL+Voffset,SansSerif,Bold,12)
DRAWTEXT("CBOS",barindex-2,CBOS+Voffset,SansSerif,Bold,12)
DRAWTEXT("DR3",barindex-2,MR3+Voffset,SansSerif,Bold,11)
DRAWTEXT("DR2",barindex-2,MR2+Voffset,SansSerif,Bold,10)
DRAWTEXT("DR1",barindex-2,MR1+Voffset,SansSerif,Bold,10)
DRAWTEXT("DS1",barindex-2,MS1+Voffset,SansSerif,Bold,10)
DRAWTEXT("DS2",barindex-2,MS2+Voffset,SansSerif,Bold,10)
DRAWTEXT("DS3",barindex-2,MS3+Voffset,SansSerif,Bold,11)
DRAWTEXT("Daily High",barindex-2,MMHI+Voffset,SansSerif,Bold,10)
DRAWTEXT("Daily Low",barindex-2,MMLO+Voffset,SansSerif,Bold,10)
DRAWTEXT("Close",barindex-2,MGAP+Voffset,SansSerif,Bold,12)
DRAWTEXT("2DHigh",barindex-2,MPDH+Voffset,SansSerif,Bold,10)
DRAWTEXT("2DLow",barindex-2,MPDL+Voffset,SansSerif,Bold,10)

ENDIF
RETURN MP COLOURED(95,95,100) as "Pivot", CBOL as "CBOL", CLNG COLOURED(102,205,170) as "CLNG", CSHT COLOURED(102,205,170) as "CSHT", CBOS as "CBOS", MR3 COLOURED (235,5,30) as "R3", MR2 COLOURED (235,5,30) as "R2", MR1 COLOURED (235,5,30) as "R1", MS1 COLOURED(30,235,5) as "S1", MS2 COLOURED(30,235,5) as "S2", MS3 COLOURED(30,235,5) as "S3", MGAP COLOURED(235,5,30) as "Close", MMHi COLOURED(45,75,240) as "Hi", MMLo COLOURED(45,75,240) as "Lo", MPDH COLOURED(45,75,240) as "PDH", MPDL COLOURED(45,75,240) as "PDL"
// To set your own colours REM out above line and undo line below
REM RETURN MP as "Pivot", CBOL as "CBOL", CLNG as "CLNG", CSHT as "CSHT", CBOS as "CBOS", MR3  as "R3", MR2 as "R2", MR1 as "R1", MS1 as "S1", MS2 as "S2", MS3 as "S3", MGAP as "Gap", MMHi as "Hi", MMLo as "Lo", MPDH as "PDH", MPDL as "PDL"
Comments
You must be logged in to post a comment.

Hi smp, how should I configure this indicator because everything is at zero -> High, Close, Prevlo, low, PrevHi. Thank you.
Hi, this is an end of day pivots indicator, so you need to find the end of day pivot info; this can be found in many places, but I use this as it is very reliable https://www.livecharts.co.uk/Members/display_stock_pivots.php Once you have this data, you can copy the high/low/close data into the boxes. Don’t forget to put previous days' high/close, and then you are good to go with the indicator drawing in all the relevant pivot points for the day. If you have this routine, it takes a couple of minutes a day. If you have any other questions then, please let me know.
I use it every day and it works fine. It sounds like you are having issues. Happy to help you sort out the installation if you want via zoom? We use this set-up every day in our trading community, so know it works fine. When running correctly, you will find this very valuable. Just let me know – I am happy to help.



Are there any instructions on how to use this indicator as on the the face of it, it looks excellent?
Using these cash indicators is a huge help and I have a number of successful strategies and use them every day. For example, closing the GAP (Cash close), R3/S3 high probability bounce and Breakaway CBOL/CBOS trades to name a few. I trade these live and record them every day in my trading community.
Thank you smp.