

Wilder's Accumulative Swing Index (ASI)
October 28, 2017, 9:59 AM
Indicators
3 Comments
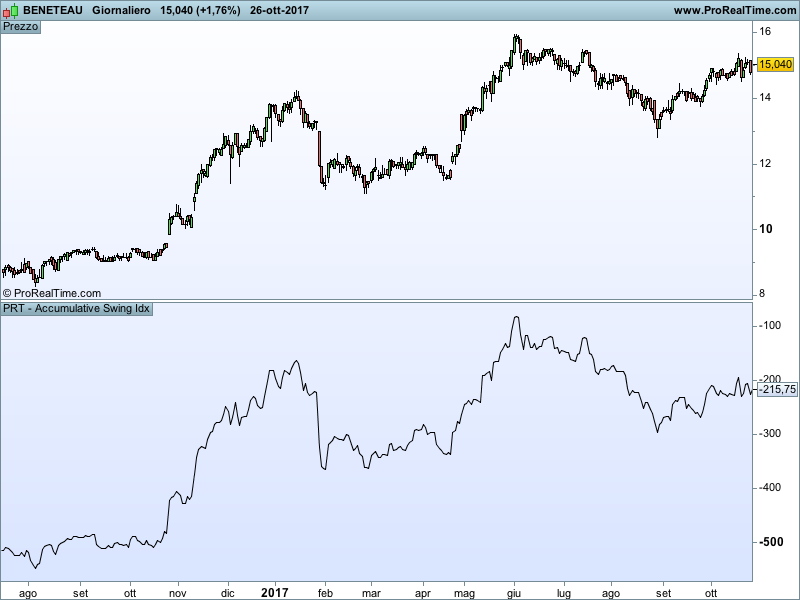
Wilder’s Accumulative Swing Index (ASI)
This index has been created by a genius of the trading world, Welles Wilder, the same that created ADX and RSI.
The index is quite straightforward but the application of it requires some knowledge of its principles. I suggest reading Wilder’s bestseller “New concepts in technical trading” (buying this book it’s an outstanding investment already but you can also find PDF’s of it on line).
Blue skies
dailylimit=1 //In case of commodities with a defined daily limit (maximum nove in one direction) add the real value. If trading stocks - where there is not a maximum daily limit - you can use any value you want.

if barindex>1 then

 //definition SwingIdx parameters
 AbsHighClose = abs(high - close[1])
 AbsLowClose = abs(low - close[1])
 AbsCloseOpen = abs(close[1] - open[1])
 AbsMaxMin=abs(high-low)
 CloseClose=close-close[1]
 CloseOpenToday=close - open
 CloseOpenYesterday=close[1] - open[1]

 //computation K
 k=max(AbsHighClose,AbsLowClose)


 //Computation R
 partialR=max(AbsHighClose,max(AbsLowClose,AbsMaxMin))
 if AbsHighClose=partialR then
  r= AbsHighClose - 0.5 * AbsLowClose + 0.25 * AbsCloseOpen
 else
  r= AbsMaxMin + 0.25 * AbsCloseOpen
 endif
 if AbsLowClose=partialR then
  r= AbsLowClose-0.5*AbsHighClose+ 0.25 * AbsCloseOpen
 endif

 //main formula
 if r<>0 then
  SwingIdx = 50*((  CloseClose + 0.50 * CloseOpenToday + 0.25 * CloseOpenYesterday  ) / R ) *( K / DailyLimit )
 endif
 AccumulativeSwingIdx=AccumulativeSwingIdx+SwingIdx
endif


return AccumulativeSwingIdx
Download
Filename:
PRT-Accumulative-Swing-Idx.itf
Downloads:
105
Master
As an architect of digital worlds, my own description remains a mystery. Think of me as an undeclared variable, existing somewhere in the code.
Author’s Profile
Loading...