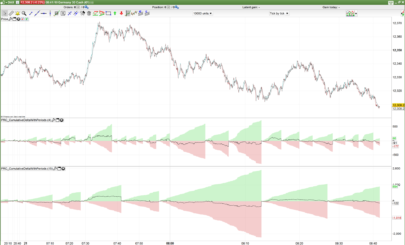
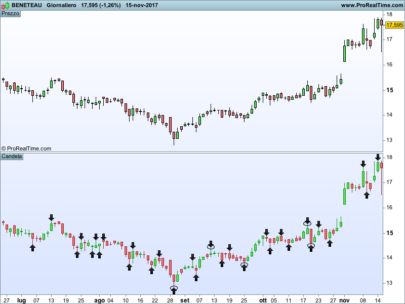
The Market Facilitation Index [1] (MFI) is the creation of Bill Williams. The indicator endeavors to establish the effectiveness of price movement by computing the price movement per volume unit. This is accomplished by subtracting the days low from the high and dividing the result by the total volume. (See below)
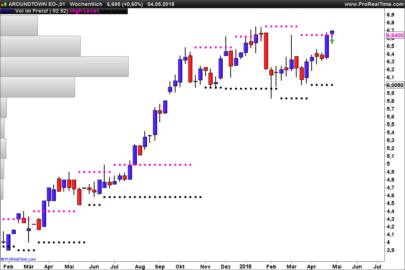
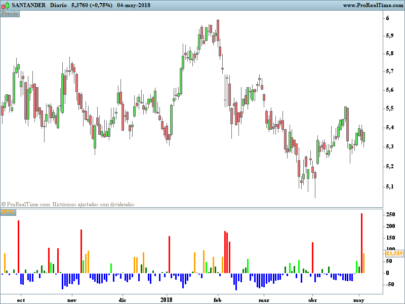
Volume MFI Label:
- Green //Green
- Fade //Blue
- Fake //Red
- Squat //Violet
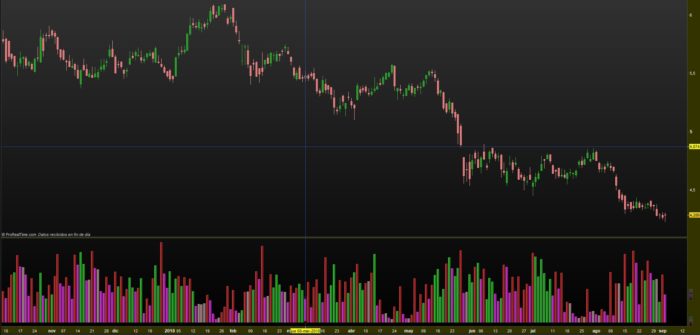
Green. This bar shows an increase in volume and the MFI relative to the previous bar. Hence, there is price movement, and the MFI is larger for this bar than that for the previous bar. Further, more players are entering the market as signaled by the increase in volume. This activity in the futures market means that off-floor traders are very active. In addition, the price action is directional–that is, the market is moving in one direction due to the involvement of new traders putting on new positions. This is the kind of day that you would already want to have a trade on in the same direction.
Fade. This bar shows a decrease in volume and the MFI relative to the previous bar. The market has slowed and there is a minor amount of activity as indicated by the low volume. This type of day is called a fade, as the traders’ interest in the market by this point is fading. Often, this sort of day happens at the end of a trend. The market has simply reached a point where nobody is willing to establish any new positions. At this point the market appears to be suffering from a certain amount of boredom. Keep in mind, however, that out of this market condition, a new trend could emerge.
Fake. This bar shows a decrease in volume but an increase in the MFI. This condition means that the market is moving more relative to the previous bar (the greater MFI), but the lack of volume is evidence that there is no new participation. The price action may be driven by just the traders in the pit and is not attracting new players from the outside. Williams has an hypothesis, that the traders in the pit may be just strong enough to push the market to price levels where there are many stop orders resting in the hands of the brokers, hence faking out the off-floor traders.
Squat. This bar shows an increase in volume relative to the previous bar, but the MFI is lower. The increase in volume indicates heavy activity, but the decrease in the MFI indicates that the market is unable to make any real headway. Volume increased, the trend has stalled and the price movement has stopped. This price action usually, but not always occurs prior to an important move in the opposite direction. This type of bar is called a squat bar because the market appears to be squatting prior to a breakout. Often, the breakout of such a bar will indicate whether this squat is a trend reversal squat or a trend continuation squat.
https://en.wikipedia.org/wiki/Market_facilitation_index
|
1 2 3 4 5 6 7 8 9 10 11 12 13 14 15 16 17 18 19 20 21 22 23 24 25 26 27 28 29 30 31 |
MFI0 = (high - low) / volume MFI1 = (high[1] - low [1]) / volume[1] a = (MFI0 > MFI1) and (volume > volume[1]) //green if a then green = mfi0 else green=0 endif b = (MFI0 < MFI1) and (volume < volume[1]) //fade if b then fade = mfi0 else fade=0 endif c = (MFI0 > MFI1) and (volume < volume[1]) //fake if c then fake = mfi0 else fake=0 endif d = (MFI0 < MFI1) and (volume > volume[1]) //squat if d then squat = mfi0 else squat=0 endif return mfi0 coloured(128,102,102) style(histogram)as "mfi",green coloured(0,128,0) style(histogram)as "green",fade coloured(0,128,0) style(histogram)as "fade",fake coloured(128,0,0) style(histogram)as "fake",squat coloured(153,0,153) style(histogram)as "squat" |
Share this
No information on this site is investment advice or a solicitation to buy or sell any financial instrument. Past performance is not indicative of future results. Trading may expose you to risk of loss greater than your deposits and is only suitable for experienced investors who have sufficient financial means to bear such risk.
ProRealTime ITF files and other attachments :
Find other exclusive trading pro-tools on ![]()
PRC is also on YouTube, subscribe to our channel for exclusive content and tutorials


no esta el color azul (Fade //Blue), No aparece en las barras el color azul.
changer
fade coloured (0,0,255)